
When you first open a trading app, you see a lot of red and green bars jumping up and down. It looks like a heartbeat monitor in a hospital. Many people think the colours are the most important thing.
They see a green bar and think they must buy because the price is going up. They see a red bar and think they must sell. Honestly speaking, this is why many people lose their first account.
I did the same thing when I started trading from my house in Ndola. I used to chase the colours like a child chasing a ball. I thought the market was telling me a secret with every new bar.
A candle is just a way to show what happened to the price over a certain amount of time, as it is a visual representation of an activity. If you look at a 1 hour chart, every candle shows one hour of trading. If you look at a 5 minute chart, every candle shows five minutes.
It is just a record of a fight. On one side, you have the buyers who want the price to go up. On the other side, you have the sellers who want the price to go down.
To read candlestick patterns for beginners in forex, you have to look past the colour. You need to see who is winning the fight and where they are winning it. A green candle does not always mean it is time to buy. Sometimes, it is just the last breath of a move before it falls.
The mistake most beginners make is thinking a candle tells them what will happen next. It does not. It only tells you what just happened.
If you use it like a crystal ball, you will be disappointed. I remember sitting at my desk, watching a huge green candle form on GBP/USD. I was so sure it would keep going that I jumped in without a plan.
Two minutes later, it turned into a tiny red candle and I lost my money. That day, I learnt that the close of the candle is the only thing that matters. Until the timer runs out, that candle can change into anything. I am not a financial adviser. This is only what I learnt from my own mistakes on the charts.
How a Candlestick Is Built Piece by Piece
Think of a candle like a summary of a day at the market. Let us say you are at the market to buy tomatoes. When the market opens at 08:00, the price is 10 dollars for a box.
During the morning, many people want tomatoes, so the price goes up to 15 dollars. But then, a big truck arrives with more tomatoes and the price drops all the way down to 8 dollars. By the time the market closes at 17:00, the price settles at 12 dollars.
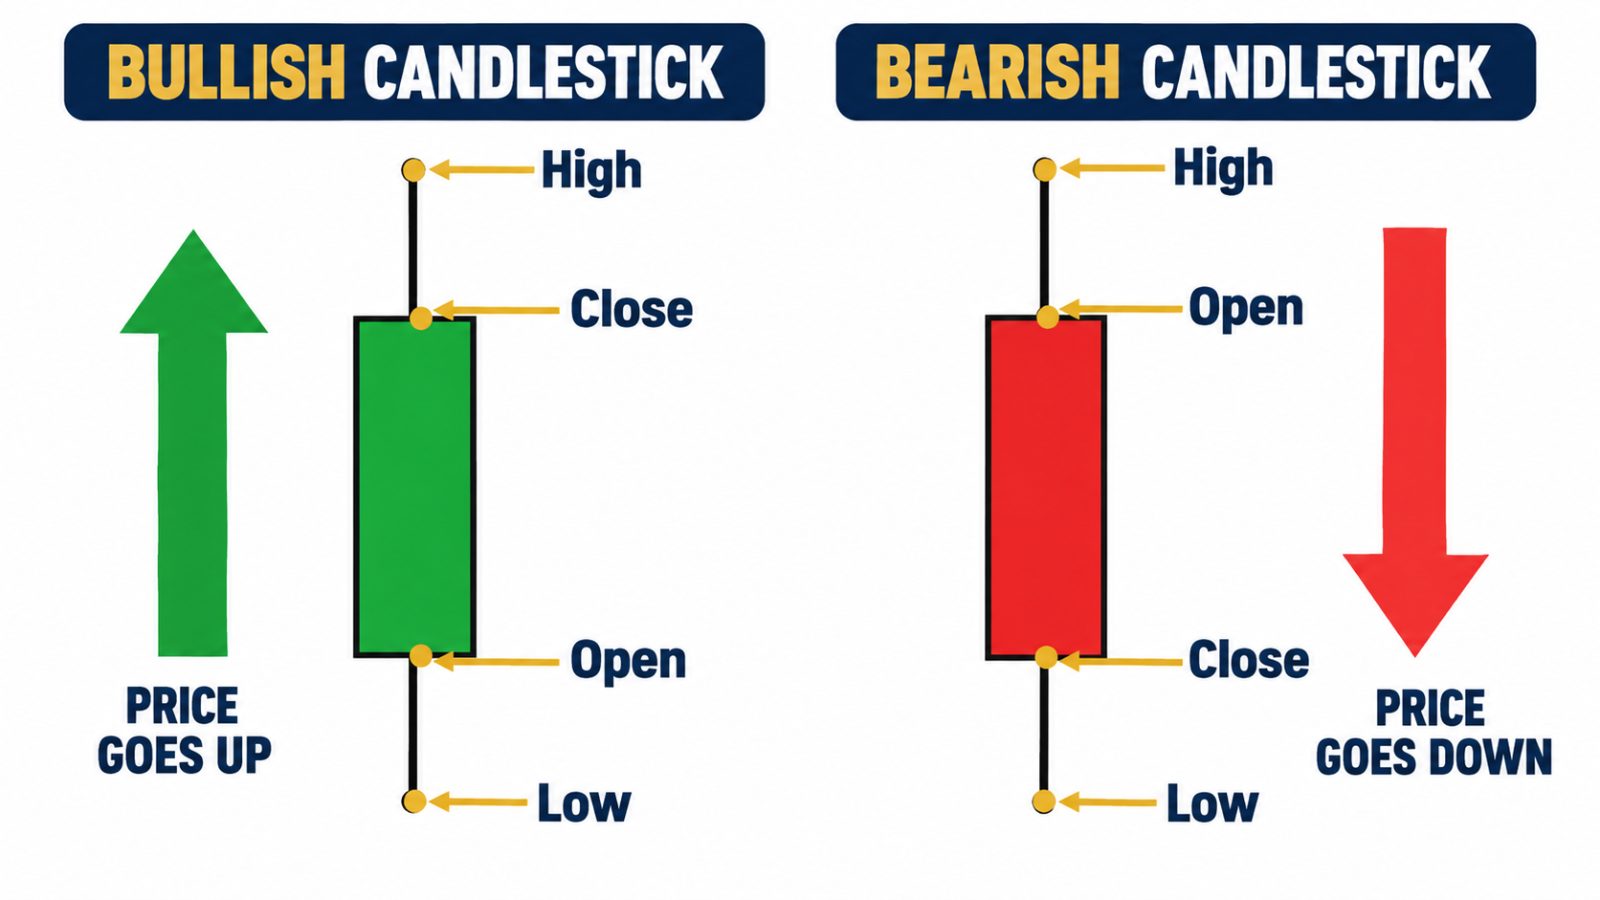
A candlestick shows all four of these numbers in one simple shape. It shows the start price, the highest price, the lowest price, and the end price.
The thick part of the candle is called the body. This shows the space between where the price started and where it ended. If the price ended higher than it started, the body is usually green.
This is a bullish candle. If the price ended lower than it started, the body is usually red. This is a bearish candle.
The thin lines sticking out of the top and bottom are called wicks or shadows. These show the highest and lowest points the price reached during that time. Traders often call these wicks because they look like the string on a wax candle. When you read candlestick wicks and shadows properly, you start to see where the market tried to go but was pushed back.
Why does this matter for your money? It matters because the body tells you who won the battle for that hour. If the body is long and green, the buyers were very strong.
If the body is tiny, it means nobody really won. Beginners often ignore the wicks, but the wicks are where the real drama happens. A long wick at the top means the price tried to go high, but sellers came in and pushed it back down.
It shows rejection. If you only look at the body, you miss this warning sign. You might buy just as the sellers are taking over the market.
What Bullish Candles Really Mean for Buyers
A bullish candle is a sign that buyers were in control. In the forex world, we call buyers "bulls" because a bull throws its horns up into the air. When you see a bullish candle, it means the price moved from the bottom to the top during that time.
But you must be careful. Not every green candle is a signal to enter a trade. You have to ask yourself where that candle is sitting on the chart.
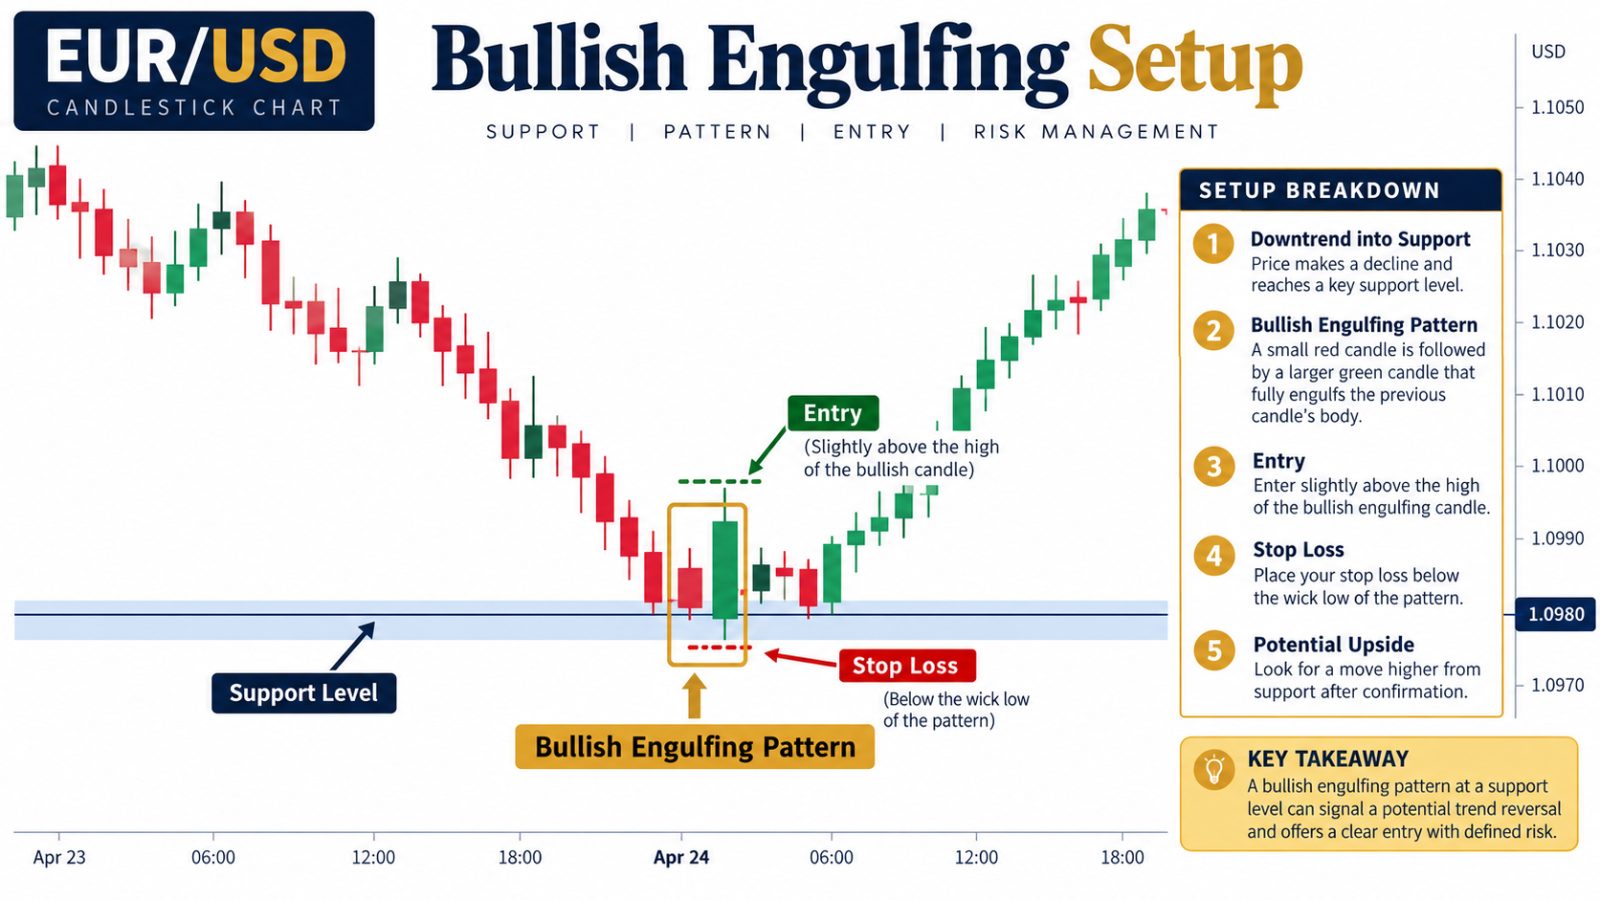
Is it sitting at a place where price usually turns around? Or is it just a random move in the middle of nowhere? This is why you must combine candlesticks with support and resistance to find the best trades.
Let us look at a real example on EUR/USD. Imagine the price has been falling for three days. It reaches a level where it has stopped and turned up many times before.
Suddenly, you see a small green candle with a long wick at the bottom. This tells you that sellers tried to push the price even lower, but they failed. Buyers came in and lifted the price back up.
This is a strong sign that the trend might be changing. In my early days, I would have missed this because I was waiting for a "big" green candle. By the time the big candle appeared, the move was already half finished. I was buying at the top instead of the start.
The biggest mistake here is "FOMO," which stands for the fear of missing out. You see a green candle moving fast and you click buy because you are afraid the price will leave without you. Usually, that fast move is just the big banks trapping small traders.
They want you to buy so they can sell to you at a higher price. Instead of chasing, wait for the candle to close. If it closes strong, look for a small pullback before you enter.
This keeps your risk small. If you enter at the top of a big candle, your stop loss has to be very far away. This means you could lose a lot of money if the price turns around.
Reading Bearish Candles Without Getting Scared
A bearish candle is the opposite. It shows that sellers were stronger than buyers. We call sellers "bears" because a bear swipes its paws down.
Seeing a lot of red on your screen can be scary if you have a buy trade open. But a bearish candle is just a piece of data. It is not an enemy.
It is telling you that for that specific time, people were more interested in selling than buying. If you see a big red candle after the price has been going up for a long time, it might be a sign that the big players are taking their profits. This is a good time to be careful with your buy trades.
Think about a pair like USD/ZAR. If the price hits a high level and then a bearish candle forms with a long wick on top, it shows that the US Dollar is losing strength against the other currency at that price. The long wick shows that buyers tried to break higher but the sellers stopped them cold.
If you learn how to trade engulfing candles, you will see that a large bearish candle that completely covers the previous green candle is a very powerful signal. It means the sellers did not just win; they completely took over the market.
Even me, I used to panic when I saw red candles. I would close my good buy trades too early because I was scared of a small pullback. I did not realise that a bearish candle is often just the market taking a breath before going higher.
To fix this, I started looking at the size of the candles. If the red candles are small and the green candles are big, the buyers are still in control. The small red candles are just a "sale" at the market.
They are giving you a better price to buy. Do not let the colour scare you. Look at the strength behind the move. One small red candle cannot stop a big uptrend.
The Secret Story Hidden in the Wicks
If the body of the candle is the news, the wicks are the gossip. They tell you what the market tried to do when no one was looking. A wick is formed when the price travels to a level but cannot stay there.
It is like a minibus that goes to a certain stage, but no passengers get on, so the driver turns around and goes back. That empty trip is the wick. In forex, wicks show us "liquidity."
This is just a fancy word for where the money is sitting. Big banks often push the price into a certain area to hit people's stop losses, then they quickly reverse the price. This leaves a long wick on the chart.
I remember a trade on AUD/USD where I saw a candle with a very long wick at the bottom. I was confused. The candle was red, so I thought I should sell.
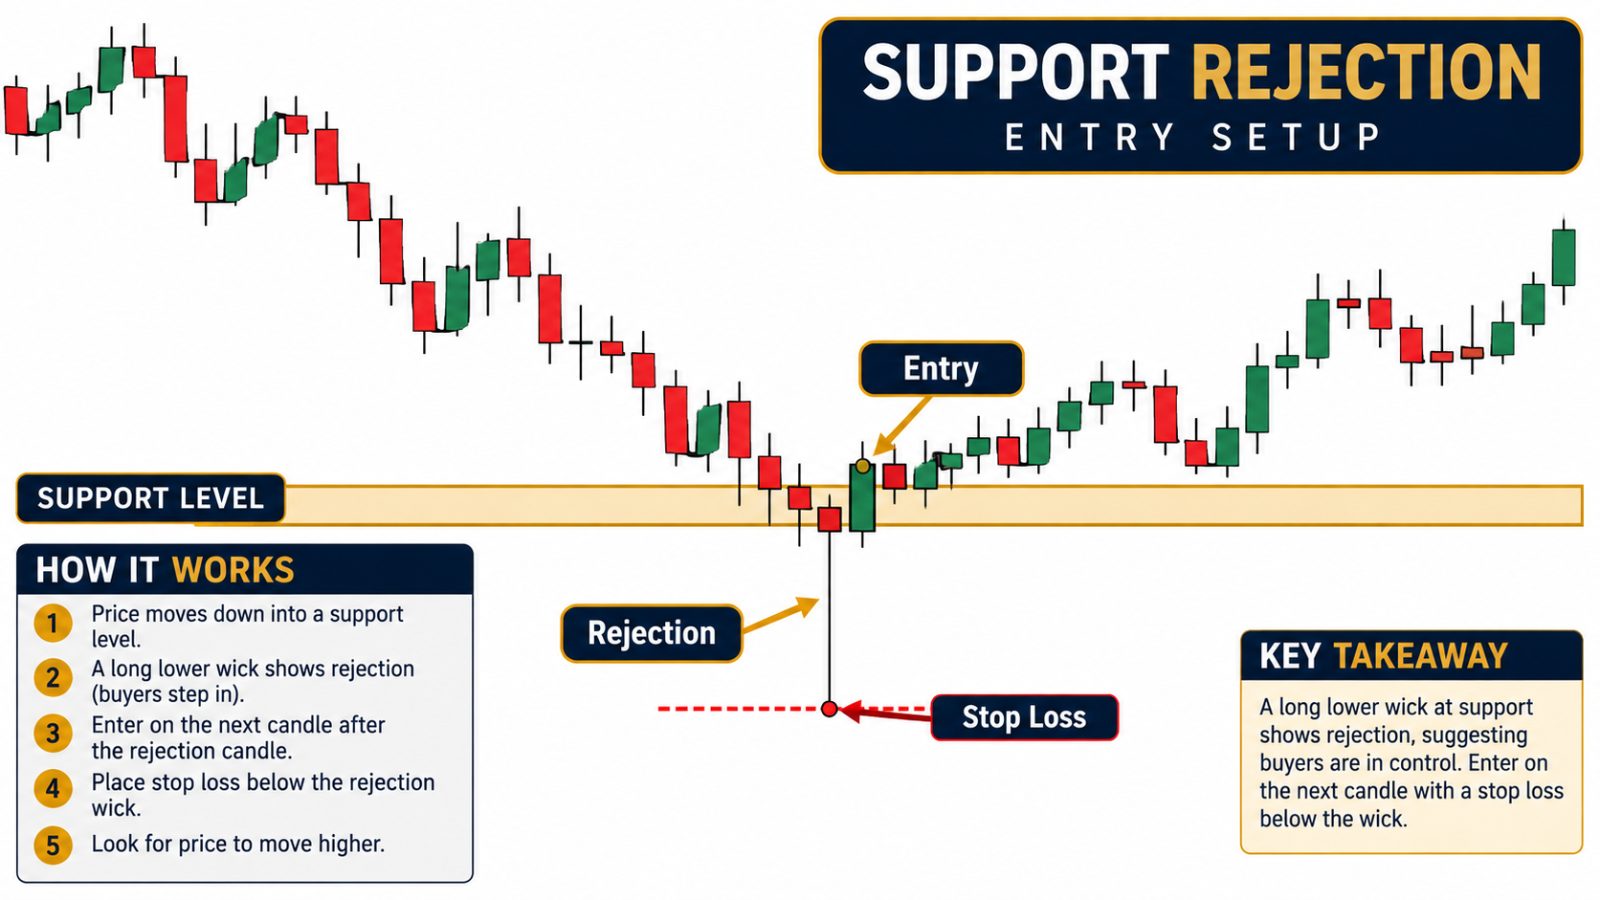
But that long wick was telling me that the price had found a lot of buyers at that low level. The sellers tried to break through, but they were pushed back with great force. This is what we call a "rejection."
If you see a long wick at the bottom of a candle near a support level, it is often a very bullish sign, even if the candle body is red. This is one of those things an experienced trader knows that a beginner does not. The wick is often more important than the body.
A common mistake is thinking that a long wick always means a reversal. It does not. Sometimes a wick is just the market "testing" an area.
You have to wait for confirmation. For example, if you see a long wick on top, wait for the next candle to start moving down before you sell. This shows that the rejection is real.
To manage your risk, you can put your stop loss just above that long wick. This way, if the price goes back up and breaks that wick, you know your idea was wrong and you can get out with a small loss. You can calculate your position size so that even if this happens, you only lose a tiny bit of your account.
Why Context Matters More Than the Candle
Imagine you see a man running very fast down the street. If you only see him for one second, you don't know why he is running. Is he late for a bus? Is he exercising? Is he running away from a dog? To understand, you need to see what is around him.
Candlesticks are the same. A single "hammer" candle or "shooting star" means nothing on its own. You need context.
Context is just the story of what happened before that candle appeared. This is why some people say candlestick patterns fail. They fail because traders try to trade them in the wrong place.
Let us walk through a step by step example. Suppose you are looking at the GBP/USD pair.
First, you look at the 4 hour chart and see the price is making higher highs and higher lows. This means the trend is up.
Next, you see the price pulling back to a level where it previously broke out. This is now a support level.
Now, you look for your candle signal. You see a bullish candle with a small body and a long lower wick right on that support line.
You decide to buy. Your entry is at 1.2550. Your stop loss is below the wick at 1.2520 (30 pips away). Your target is the next high at 1.2640 (90 pips away).
This gives you a risk to reward ratio of 1:3. If you risk 10 dollars, you stand to make 30 dollars. Because you have the trend and the support level on your side, this candle has a much better chance of working.
The mistake people make is looking at a 1 minute chart and trying to trade every candle they see. On a tiny timeframe, candles are like noise. They move up and down for no real reason.
It is like trying to guess the weather by looking at one single cloud. You will get frustrated and lose your money quickly. Even me, I spent months trying to trade the 1 minute chart.
I thought I could make money faster. All I did was pay a lot of spread to the broker and get a headache. Now, I prefer to find my daily bias first on the higher timeframes. It is much calmer and more reliable.
The Trap of Memorising Candle Names
There are hundreds of names for candlestick patterns. You have the "Evening Star," the "Hanging Man," the "Dark Cloud Cover," and many more. When I was new, I bought a big book and tried to memorise all of them.
I felt like a scientist. But when I sat in front of the live chart, I got confused. I kept seeing patterns that weren't really there.
I was so busy looking for a "Morning Star" that I forgot to look at what the price was actually doing. Don't fall into this trap. The names are not important. The pressure between buyers and sellers is what matters.
Instead of names, think about "Who is in trouble?" If the price has been going up and suddenly a big bearish candle appears, the buyers who just bought at the top are now in trouble. They are losing money.
When they start to close their trades, it pushes the price down even more. This is how a reversal starts. It is not magic; it is just people reacting to losing money.
If you can spot where traders are trapped, you can predict where the price will go. For example, trading a pin bar is really just trading a moment where one side tried to move the market and failed miserably.
One thing an experienced trader knows is that the "perfect" candle rarely exists. In books, the candles look very neat. In the real market, they are messy.
Sometimes the wick is a bit too short, or the body is a bit too long. If you wait for the perfect shape, you will never take a trade. Look for the message instead.
Is the candle showing strength or weakness? Is it showing rejection or acceptance of a price? If you can answer that, you don't need to remember a hundred Japanese names.
Just watch the battle. It tells you everything you need to know if you are patient enough to listen.
Your Plan for Today: Stop Watching, Start Reading
Reading bullish and bearish candlesticks is a skill that takes time to master. You cannot learn it in one day, just like you cannot learn to farm by reading one book. You have to spend time looking at the charts.
But don't just look at them. Read them. Ask yourself why the current candle looks the way it does.
Who is winning right now? Where are the losers hiding? This mindset shift will change how you see the market forever. It stops being a gambling machine and starts being a map of human emotions.
Today, I want you to do one simple thing. Open your chart on a 4-hour timeframe. Pick a major pair like EUR/USD or GBP/USD.
Go back in time and find five places where the price turned around. Look at the candles that formed right at that turning point. Don't look for names.
Just look at the wicks and the bodies. Do you see the rejection? Do you see how the candles got smaller before the turn and bigger after the turn?
This is the market talking to you. Once you start to hear it, you will never look at a green or red bar the same way again.
Trading is hard, and most people give up because they want quick money. They chase the big candles and get burnt. But if you take it slowly, one candle at a time, you can learn this.
Remember, I am not your financial adviser. I am just a trader who has been where you are. I have lost the accounts and felt the frustration.
The only difference is I kept showing up and I stopped trading the colours. I started trading the story. You can do the same.
Just be patient with yourself and keep your risk small while you learn. The market will always be there tomorrow.
Where To Read Next
If you want to keep learning, these are the ones I would read next.
Frequently Asked Questions
Is a green candle always a buy signal?
No, a green candle only means the price closed higher than it opened in that time period. It could be a trap or just a small bounce in a big downtrend. You should only buy if the green candle happens at a strong support level and fits the overall trend.
What is the most important part of a candlestick?
The close of the candle is the most important part because it tells you who won the battle. However, the wicks are also vital because they show where the price was rejected. Always wait for the candle to close before making a decision.
Why do candles look different on different timeframes?
Each timeframe groups the price data differently. A single 1-hour candle is made up of four 15-minute candles. This is why a trend might look bullish on a small timeframe but bearish on a large one. Always check the higher timeframe to see the real direction.
How can I tell if a candle is a fakeout?
A fakeout often looks like a very strong, fast-moving candle that breaks a level but then quickly leaves a long wick and closes back inside. If you wait for the candle to close, you can often avoid these traps. Big banks use these moves to catch retail traders off guard.
Should I memorise all the candlestick pattern names?
It is better to understand the logic of the candle rather than memorising names. Focus on understanding rejection, momentum, and where traders might be trapped. If you understand the story of the buyers and sellers, the names don't matter.
Found this helpful? Share it with someone who needs it.