
How Candlestick Patterns for Beginners Actually Work in the Market
Most traders lose money because they see candles as still pictures. They are not. They are a live fight between buyers and sellers. When you learn candlestick patterns for beginners, you are really learning to read a map of who won that fight.
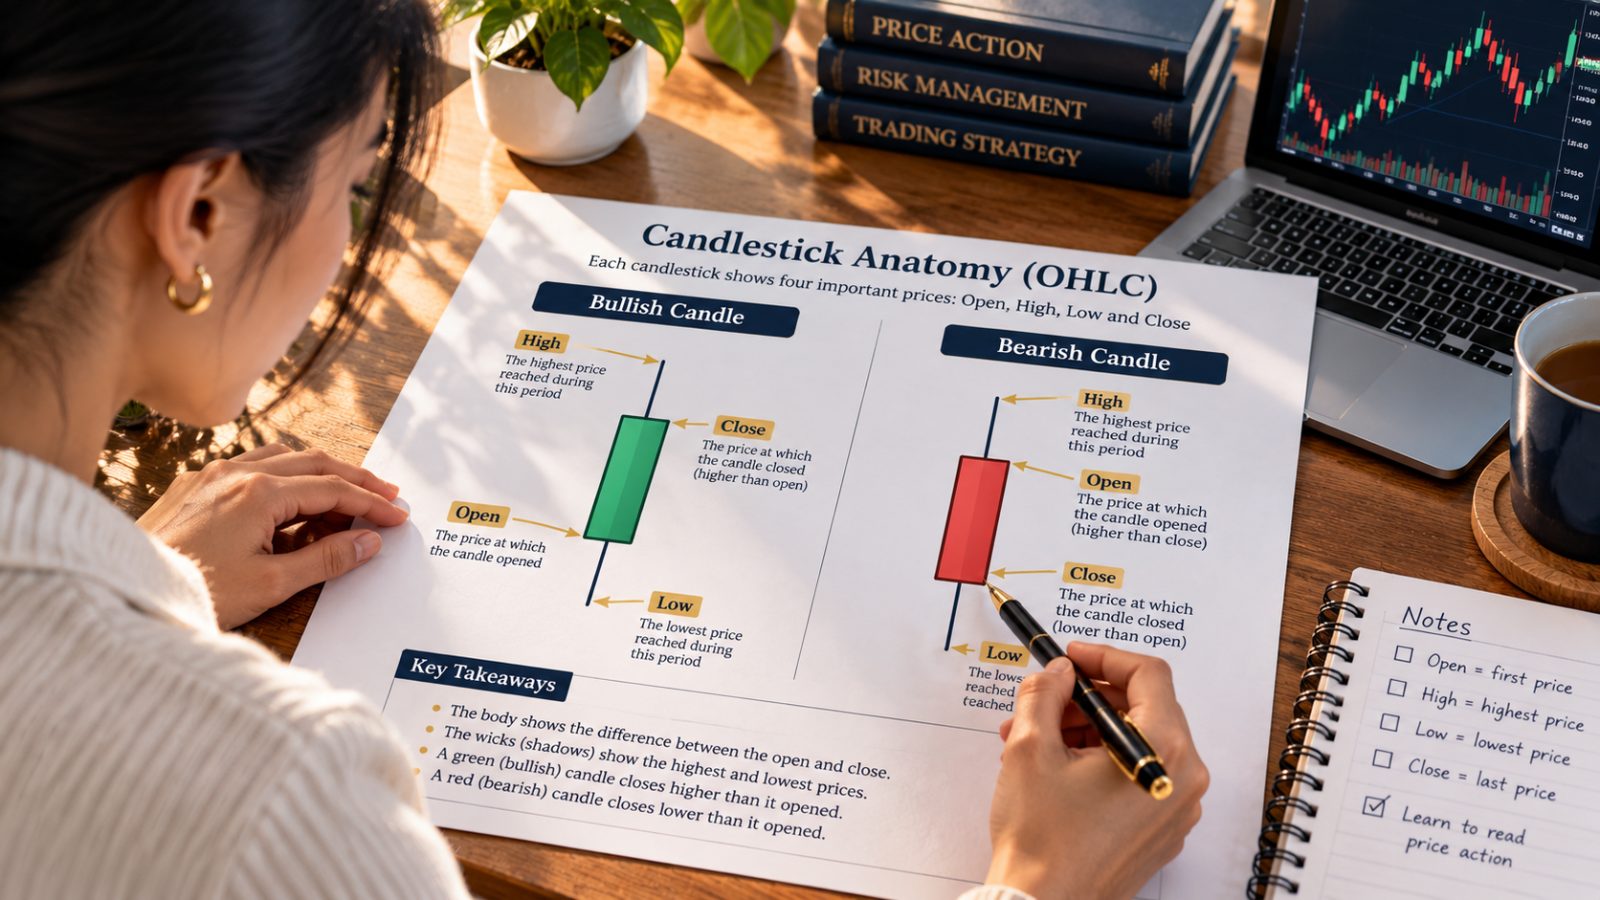
Each candle shows four things: the Open, the High, the Low, and the Close. The fat part is the body. It shows where the price started and where it ended. The thin lines sticking out are wicks. They show how far the price pushed before it was pushed back.
I used to print out charts with dozens of patterns. I memorised names like Morning Star and Doji. I thought these shapes were magic signs to buy or sell. I would see a shape, enter a trade, and lose. I did this for months on pairs like EUR/USD. I was just guessing based on a picture. I ignored the real story: the money flow behind the candles.
The Four Pieces of Every Candle: Reading Price Action from Scratch
Think of a candle as a clock. If you use a one hour chart, that candle shows sixty minutes of trading. The four numbers are the Open, High, Low, and Close. We call this OHLC.
Open: The price when the hour started.
High: The top price reached before buyers gave up.
Low: The bottom price reached before sellers gave up.
Close: The final price when the hour ended.
If the body is long, one side was very strong. If the body is tiny, the buyers and sellers were matched. They were fighting to a draw.
Body Momentum: How to Measure Market Urgency
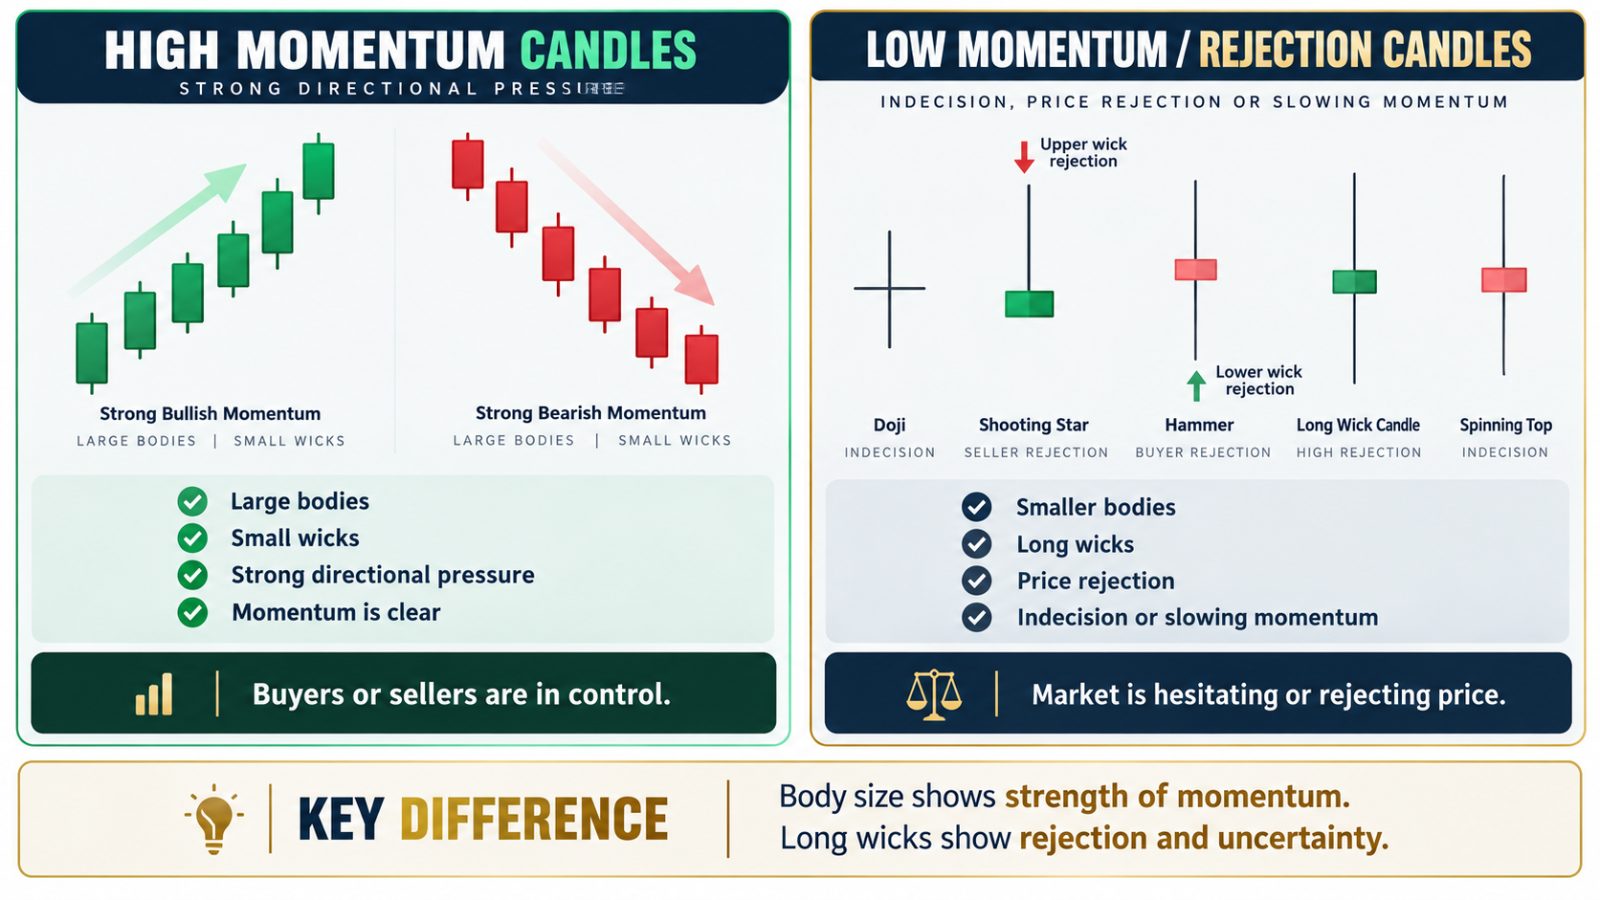
Big bodies show urgency. When a bank wants to buy a lot of currency, they move the price fast. You see big candles. I look for these to see if the trend is strong.
If the candles are getting smaller, the trend is tired. Imagine you are running. You start fast, but soon you slow down. The market does the same. If three big candles go up, but the next three are tiny, the buyers are losing their steam. Do not chase the price when the momentum fades.
The Truth About Wicks: Rejection, Sweeps, and Hidden Traps
A long wick is not always a sign to trade. Many people see a long wick and think the price will turn. Sometimes, it is just a trap.
Big banks need to fill large orders. They often push the price past a level to trigger your stop-loss. A stop-loss is just an order to sell. The bank buys those orders to fill their own position. Then, they push the price the other way. This is a sweep. You need to know if the wick hit a real level of interest or if it was just a trap.
Essential Candlestick Patterns for Beginners: The Single Candle Group
Single candles give you a quick update. A Hammer has a small body and a long wick at the bottom. It shows that sellers tried to push price down, but buyers stepped in to stop them.
A Shooting Star is the opposite. It has a long wick at the top. It means buyers tried to go up, but sellers pushed them back. A Doji is a cross. It means nobody won. The price finished right where it started.
I once saw a perfect Hammer on a 15-minute chart. I bought it immediately. I didn't check the higher charts. The price was hitting a major wall of sellers on the 4-hour chart. My Hammer was crushed. I learned that a pattern is only as good as the place where it happens.
Two Candle Patterns: Spotting Real Momentum Shifts
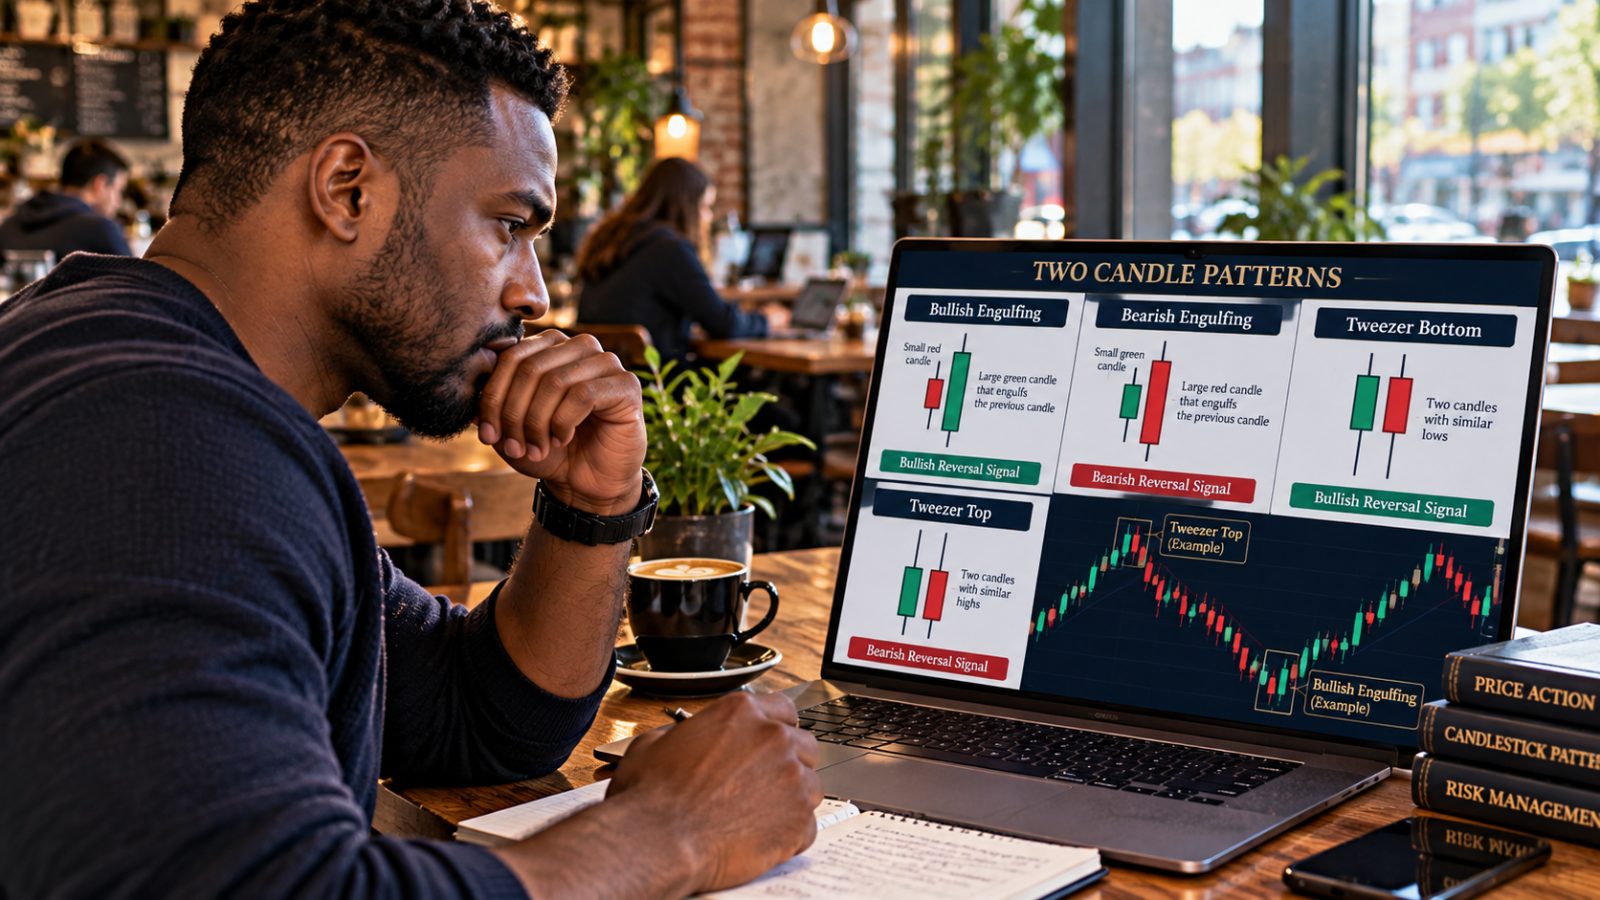
Two candles can show a shift in power. An Engulfing pattern happens when the second candle covers the first one completely. If a small red candle is followed by a big green one, the buyers have taken control.
A Tweezer pattern happens when two candles touch the same price. If they both hit a bottom and refuse to go lower, that is a strong floor. It shows that buyers are protecting that price.
Multi Candle Setups: The Structural Turning Points
Three candles can show a full reversal. A Morning Star looks like a big red candle, then a tiny candle, then a big green one. It shows a move that stops and then turns around.
Three White Soldiers are three big green candles in a row. This is pure speed. Do not try to fight this. When the market moves this fast, just watch or follow the flow.
Why Most Retail Traders Fail When Trading Candlestick Patterns
Most traders lose because they trade in the middle of nowhere. They see a shape and click buy. But a shape is only helpful at a key level.
Common mistakes:
Trading without a plan.
Ignoring the main trend.
Trading while the candle is still moving.
Ignoring the broker's spread.
Never trade until the candle is closed. A candle can look like a winner with ten seconds left, then turn red at the last second.
How to Read Market Intent: Confluence, Levels, and Timeframes
You need confluence. This means having more than one reason to trade. If you see a bullish engulfing pattern at a major support level, that is confluence.
I remember a trade on a 4-hour chart. I saw a clear engulfing pattern at a level that had held for weeks. I waited for the candle to close. I set my stop-loss below the pattern. I felt calm because I knew why I was in the trade. I was not guessing. I was following the setup.
I am not your financial adviser, this is only what worked for me.
A Step by Step Routine to Analyse Any Chart Using Candlesticks
Check the 4-hour chart. What is the main trend?
Find where price has turned before. Draw a line there.
Watch the candles as they approach your line. Are they slowing down?
Wait for a pattern to form at your line. Wait for the close.
Reality Check: What Candlestick Patterns Cannot Do
Patterns are not crystal balls. They are just guesses based on past behavior. Sometimes they fail. You must use a stop-loss to protect your money. If you risk too much, one bad trade will hurt you. Keep your risk small and your focus on the process.
Where To Read Next
Learn more about how to trade the market correctly:
Frequently Asked Questions
How do I read candlestick patterns for beginners without getting overwhelmed?
Start with only two patterns. The Hammer and the Engulfing. Do not look for anything else. Only trade them at major levels.
Is trading candlestick patterns actually profitable for retail traders?
It can be if you have a plan and keep your risk small. It is not about the pattern; it is about where the pattern happens.
What is the best timeframe to trade candlestick patterns for beginners?
Use the 4-hour chart. It is much clearer than the 5-minute chart. It has less noise.
Why do candlestick patterns fail so often on lower timeframes?
The 1-minute and 5-minute charts are full of traps. Banks use these to hunt for stop-losses. It is too hard for a beginner.
Should I enter a trade immediately when a candlestick pattern starts forming?
No. Always wait for the candle to finish. If you enter early, you are gambling, not trading.
Found this helpful? Share it with someone who needs it.