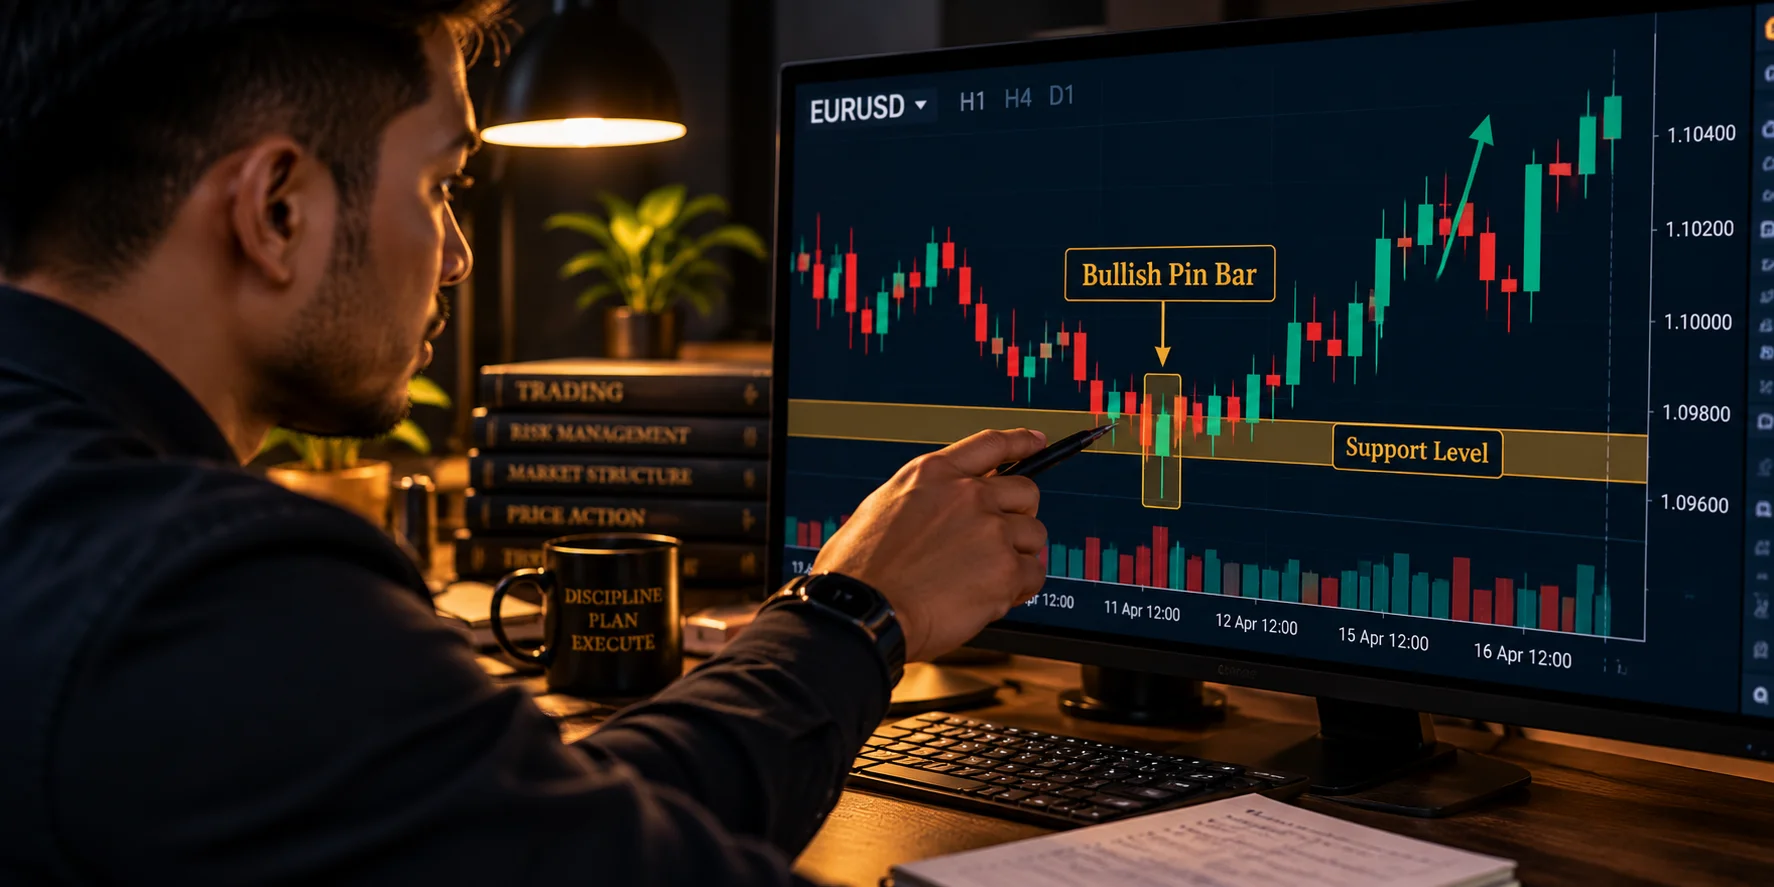
Why Candlestick Patterns Fail Without Levels
If you trade every bullish engulfing candle you see on a 15 minute chart, you will likely lose money fast. I believe the math of trading random patterns is brutal. You cannot just look at a candle and expect it to move price.
Most traders treat one candle like it is a magic sign. They look at the shape and assume it tells the future. That is a mistake. A candle is just a footprint of a battle between buyers and sellers. If you want to move past the myths, How to Read Bullish and Bearish Candlesticks in Forex will help you understand what those shapes actually mean for your trades.
Before you do anything else, you must learn how price actually forms on the chart. Most beginners get this wrong. A candle in the middle of nowhere means nothing. But a candle at a big price level? That is a different story. You need to combine candlesticks with support and resistance to make sense of the noise.
The Real Mechanics of Support and Resistance Zones
Support and resistance are not just lines. Think of them as zones where big banks and funds have piles of orders waiting. When price hits these zones, the market does not just bounce. It reacts to a fight for liquidity.
Liquidity is just a fancy word for cash waiting to be spent. Imagine a big pool of money. If price drops into a support zone on a 4 hour chart, big players want to buy. But they need sellers to fill their orders. They often push price just below the support line to force retail traders to panic-sell. This creates the orders the big players need. Once those orders are filled, the market turns around.
Retail traders often call this a reversal. I call it a liquidity sweep. When you see a long wick on a candle at a key level, you are seeing the result of that fight. I stopped trading random shapes once I realised this. Now I wait for the market to test these real barriers.
How to Read Rejection Wicks at Key Levels
Wicks show the story of a battle. A long lower wick means sellers tried to push price down, but buyers were too strong. They pushed it right back up.
I remember early on, I saw a long wick on the daily chart. I rushed in to buy. I did not wait for the candle to close. Price dropped, hit my stop, and then shot up exactly where I wanted. I learned that day that a wick is only a signal if it happens at a real, tested price level.
If you see a long wick in empty space, ignore it. If it happens at a major daily price level, pay attention. The context makes the signal.
Combining Trendlines With Candlestick Clues
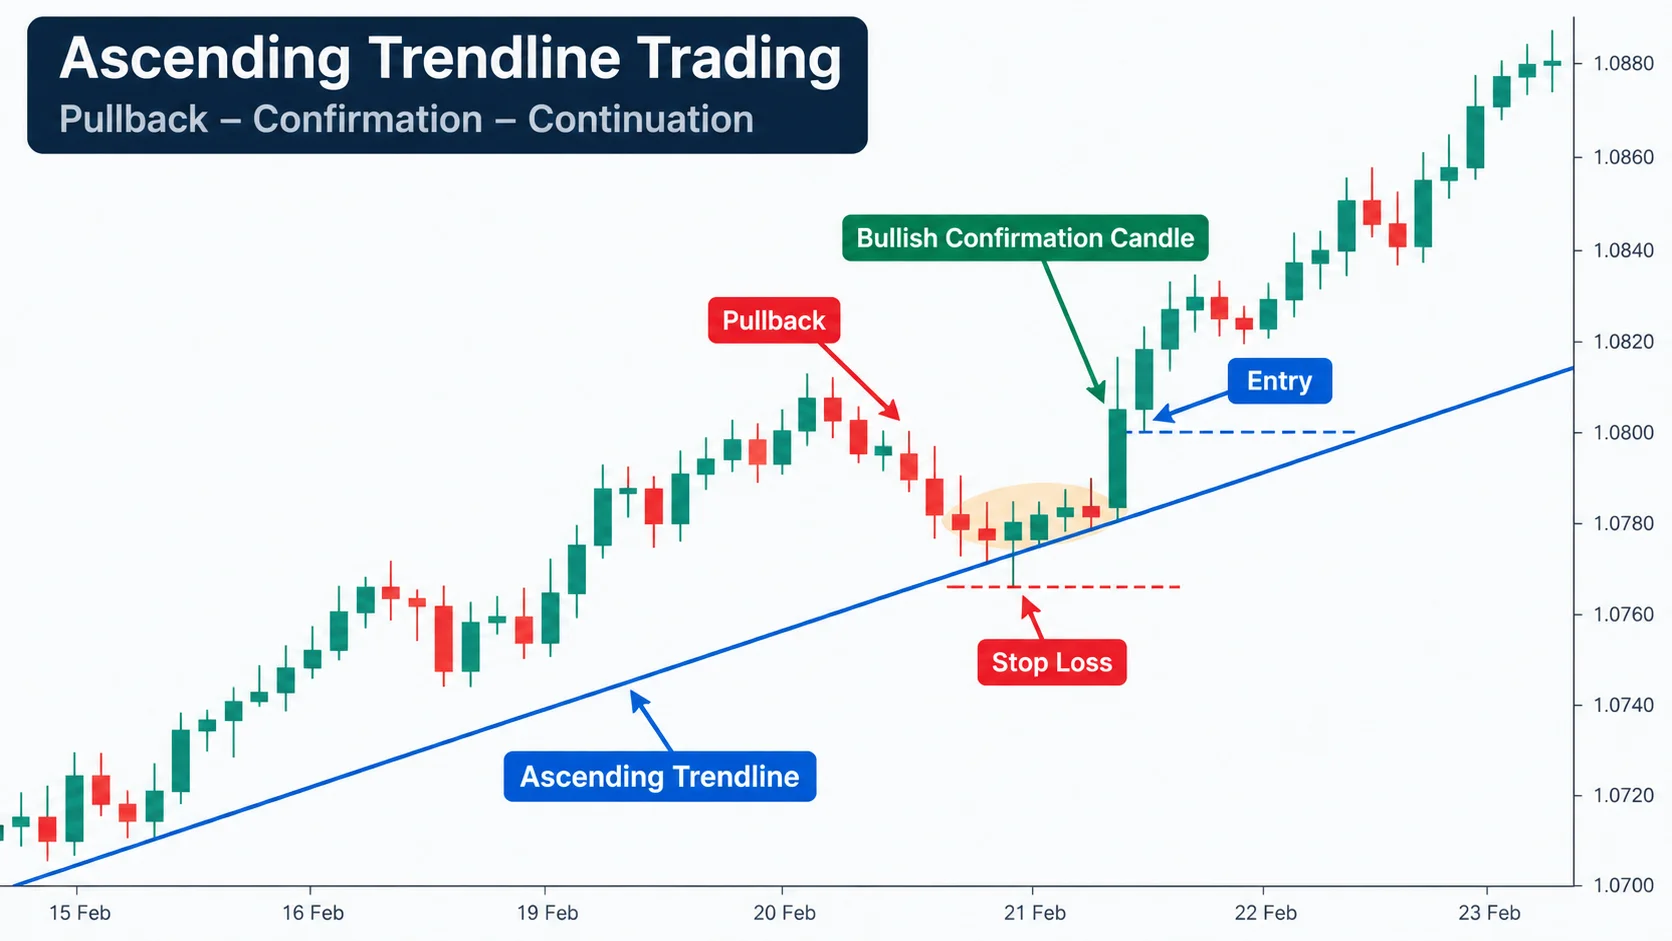
Trendlines are just angled levels. They work the same way as horizontal lines. But keep your charts clean. Too many lines will only confuse you.
When price pulls back to a trendline, watch the candles. If they get smaller and look hesitant, momentum is dying. That is a great sign. Then, wait for a strong candle to close away from the line. That confirms the trend is likely to continue.
The Danger of Trading Every Level You Find
Not every level matters. If a level has only been touched once on a 5 minute chart, it is just noise. Big institutions do not care about 5 minute charts. They look at daily and 4 hour charts.
Focus on levels where price moved fast in the past. If a daily level also hits a round number, like 1.3000, that is a strong area. Wait for the market to show you its hand at these spots. Do not guess.
Step by Step Process to Execute the Strategy
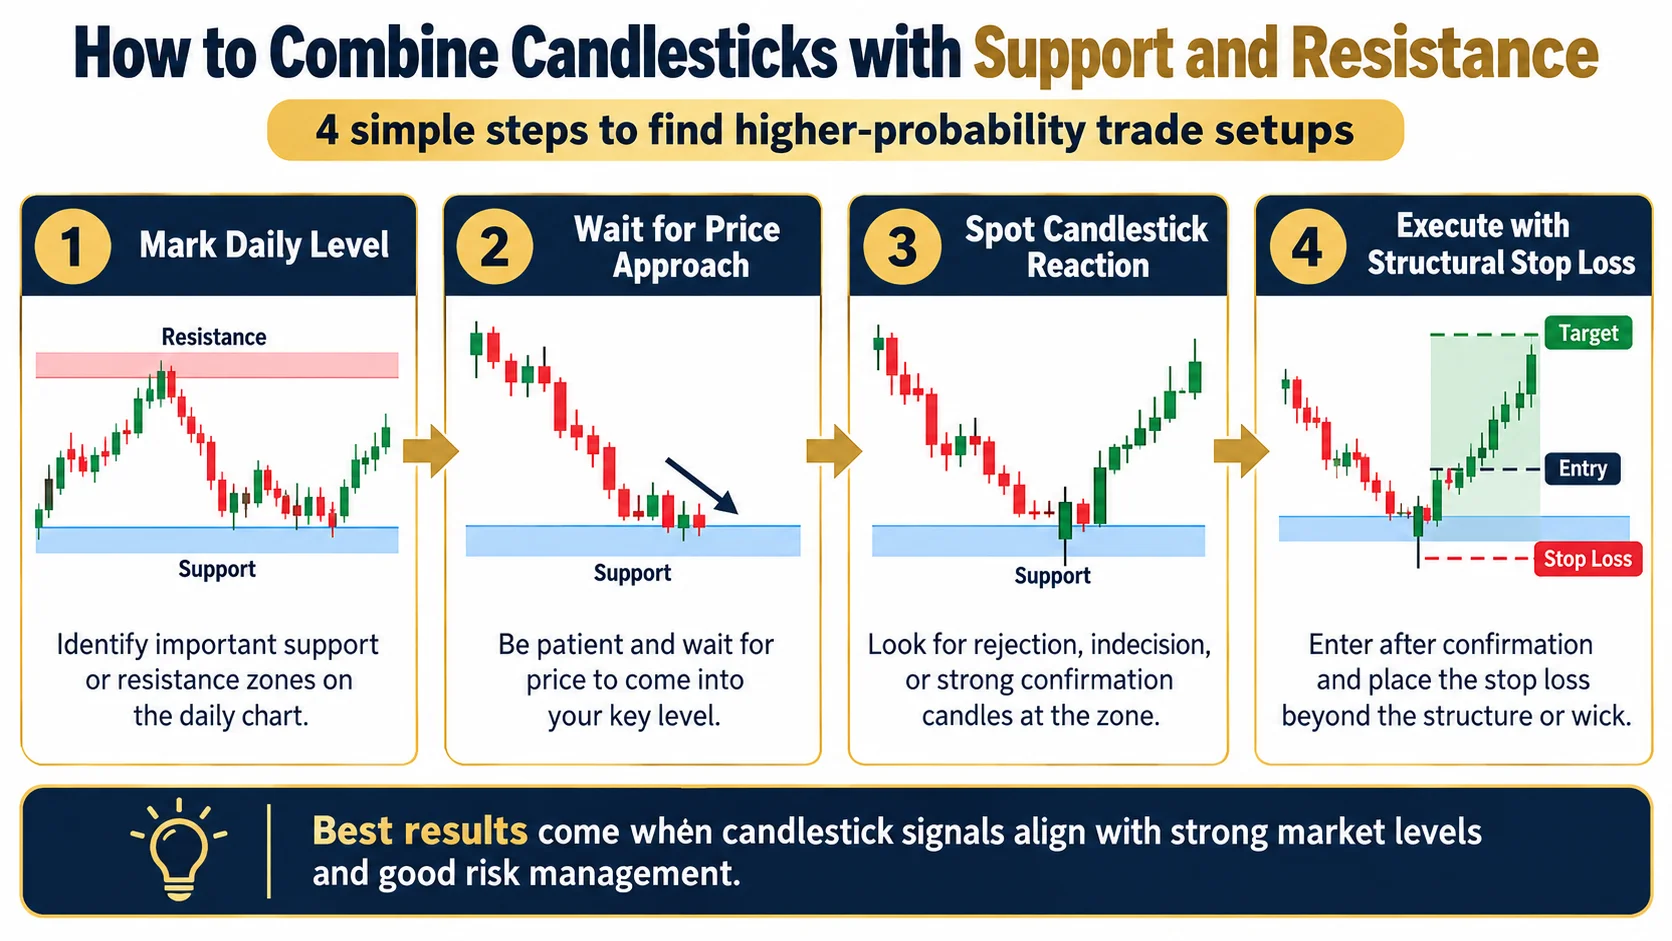
Here is how I do it. First, I mark big turning points on a daily chart. Second, I look at the 4 hour chart to see how price gets to those points. Third, I wait for a clear candle, like a pin bar, at that zone. If you want to master these specific setups, How to Trade Hammer and Shooting Star Candles in Forex explains why most retail traders get these wrong.
Fourth, I plan my risk. I put my stop loss on the other side of the level. Let us say you are trading USDJPY at 155.00 resistance. You see a big bearish candle close below that number. You sell. You put your stop loss at 155.45. Your target is the next support at 153.50. This gives you a clear plan based on structure, not just a feeling.
Why Most Traders Still Lose Money Doing This
Even with a good plan, you can fail. People get impatient. They enter before the candle closes. Or they move their stop loss when they get scared.
I once took a perfect setup at support. But there was a big news event coming in ten minutes. I ignored the news. Price spiked, hit my stop, and then went my way. It was a painful lesson in context.
You must use proper position sizing. If you risk 1 percent of your money, a loss does not hurt your account. You can stay in the game. That is how you survive.
Where To Read Next
To keep learning about how to combine candlesticks with support and resistance, check these out:
Why Do Candlestick Patterns Fail Without Context in Forex
How to Trade a Pin Bar Candlestick Strategy in Forex
- How to Read Candlestick Patterns for Beginners in Forex
- How to Trade Hammer and Shooting Star Candles in Forex
- How to Trade Bullish and Bearish Engulfing Candles in Forex
- How to Read Bullish and Bearish Candlesticks in Forex
- How to Trade a Pin Bar Candlestick Strategy in Forex
Frequently Asked Questions
How do I combine candlesticks with support and resistance effectively in forex?
Wait for price to test a major level on a high timeframe. Look for a clear rejection candle before you enter. The level is the context, and the candle is your trigger to act.
Why do my candlestick patterns keep failing at support levels?
You might be entering too early before the candle closes. Also, try to use daily or 4-hour charts. Small charts have too much noise and not enough institutional interest.
How do I know if a support level is strong enough to trade?
A strong level usually has been tested multiple times in the past. It often aligns with a round number and shows a sharp move away from it historically.
Where should I place my stop loss when trading candlesticks at resistance?
Place it just beyond the extreme wick of the signal candle. If that is too close, put it just behind the structural high. Keep your risk to 1 or 2 percent of your account.
Is trading candlestick patterns at key levels profitable for retail traders?
It can be if you have good risk management. It is not about winning every trade. It is about taking high-quality setups at important levels and cutting your losses when you are wrong.
Found this helpful? Share it with someone who needs it.