The Story Behind the Shadow
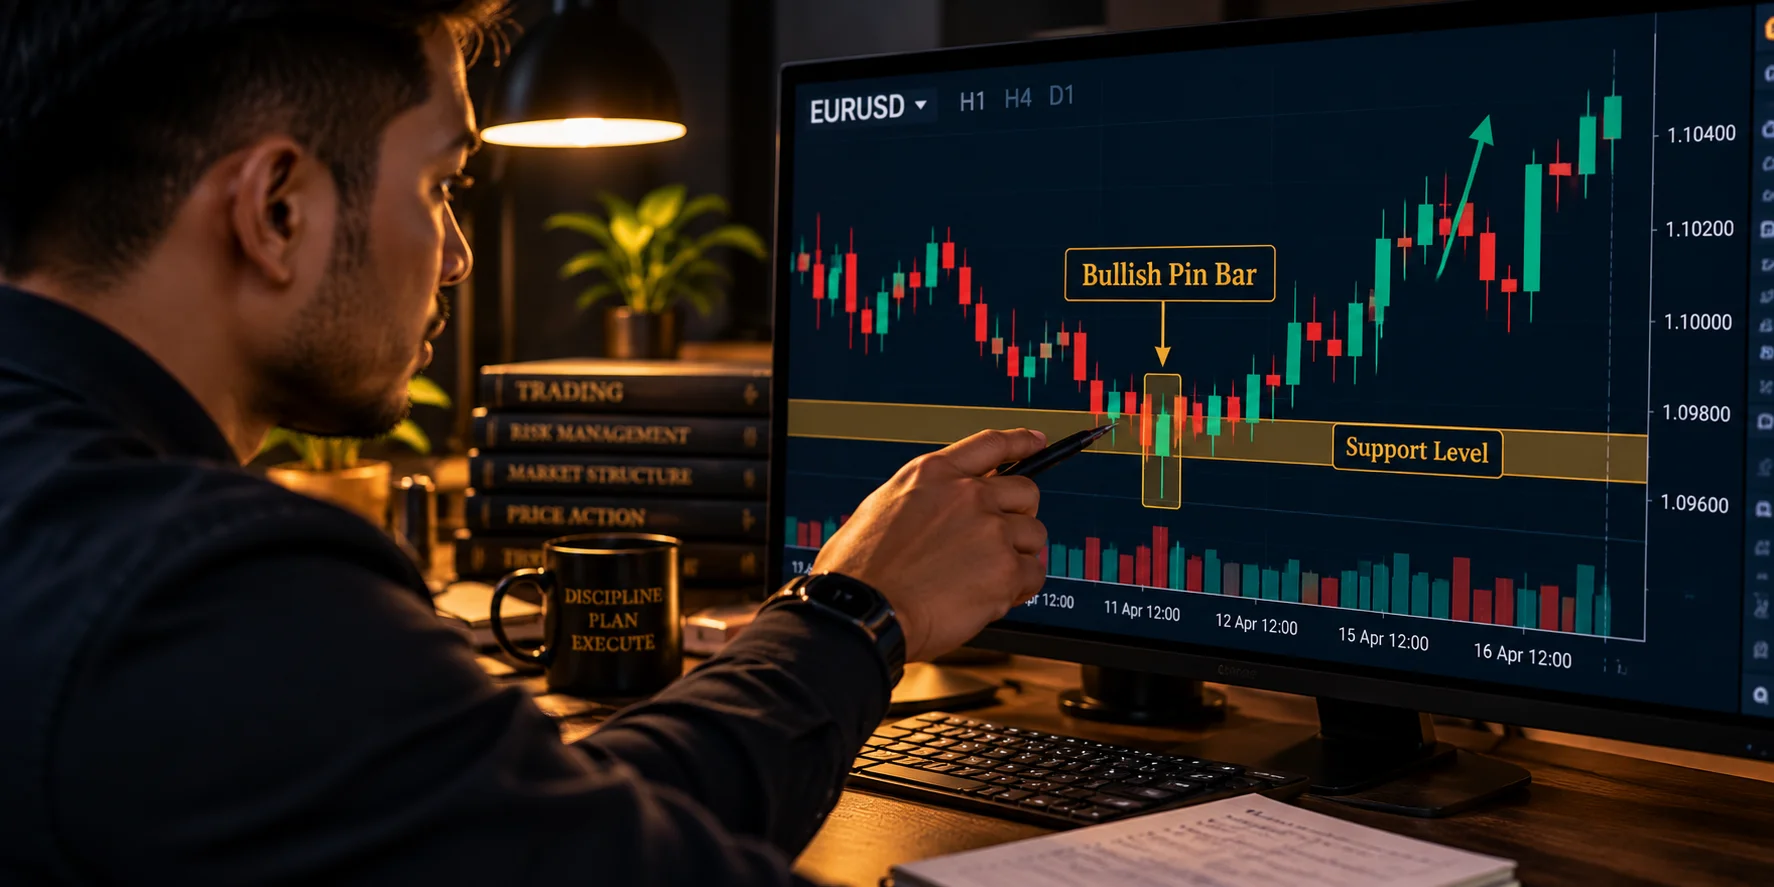
Most traders look at the solid part of a candle and ignore the thin line sticking out. That is a mistake. The solid block is the body. It shows where price started and ended. The line is the wick. It shows where price went, but where it refused to stay.
If you only look at the body, you are missing half the story. To truly read candlestick wicks and shadows, you must see them as a map of a fight. They show you exactly where the market was pushed back.
How Price Actually Moves Inside a Wick
New traders think wicks are just random noise. They are wrong. A wick is a footprint left by big banks and firms. Think of it this way: when price moves, it hits orders left by other people. If it hits a wall of sell orders, price drops fast. That leaves a long line behind.
Imagine the GBPUSD pair on a 4 hour chart. Price hits a high point. It triggers many "buy" orders from people who think it will keep going up. But then, big banks sell a huge amount. Price crashes back down. The candle closes much lower than that high. The line left behind is the wick. It shows that the "breakout" was a trap.
I once saw a big move on a chart and jumped in. I thought the breakout was real. It was just a trap. I learned that wicks show where the big money is hiding. When you learn to spot these, you stop chasing moves and start waiting for the reversal.
The Pillar Foundation of Price Action
You cannot use this skill if you do not know the basics. You need to know how candles are built first. A candle has four points: where it starts, where it ends, the highest point, and the lowest point.
When the high or low is far away from the start or end, you get a long wick. It means the market tried to go there but failed. If you find the basics confusing, go back and study them. If you skip this, every wick just looks like a meaningless line to you.
Reading the Wick-to-Body Ratio
Look at the size of the body compared to the wick. A tiny body with a massive wick means the market is shouting at you. It means there is a big fight, and one side won quickly.
If the wick is twice as long as the body, pay attention. If it is four times as long, be very careful. For example, on the EURUSD daily chart, if price shoots up fifty pips but closes back at the start, that fifty pip line is a warning. It means buyers tried to break a wall and were pushed back hard.
Why Long Upper Shadows Signal Exhaustion
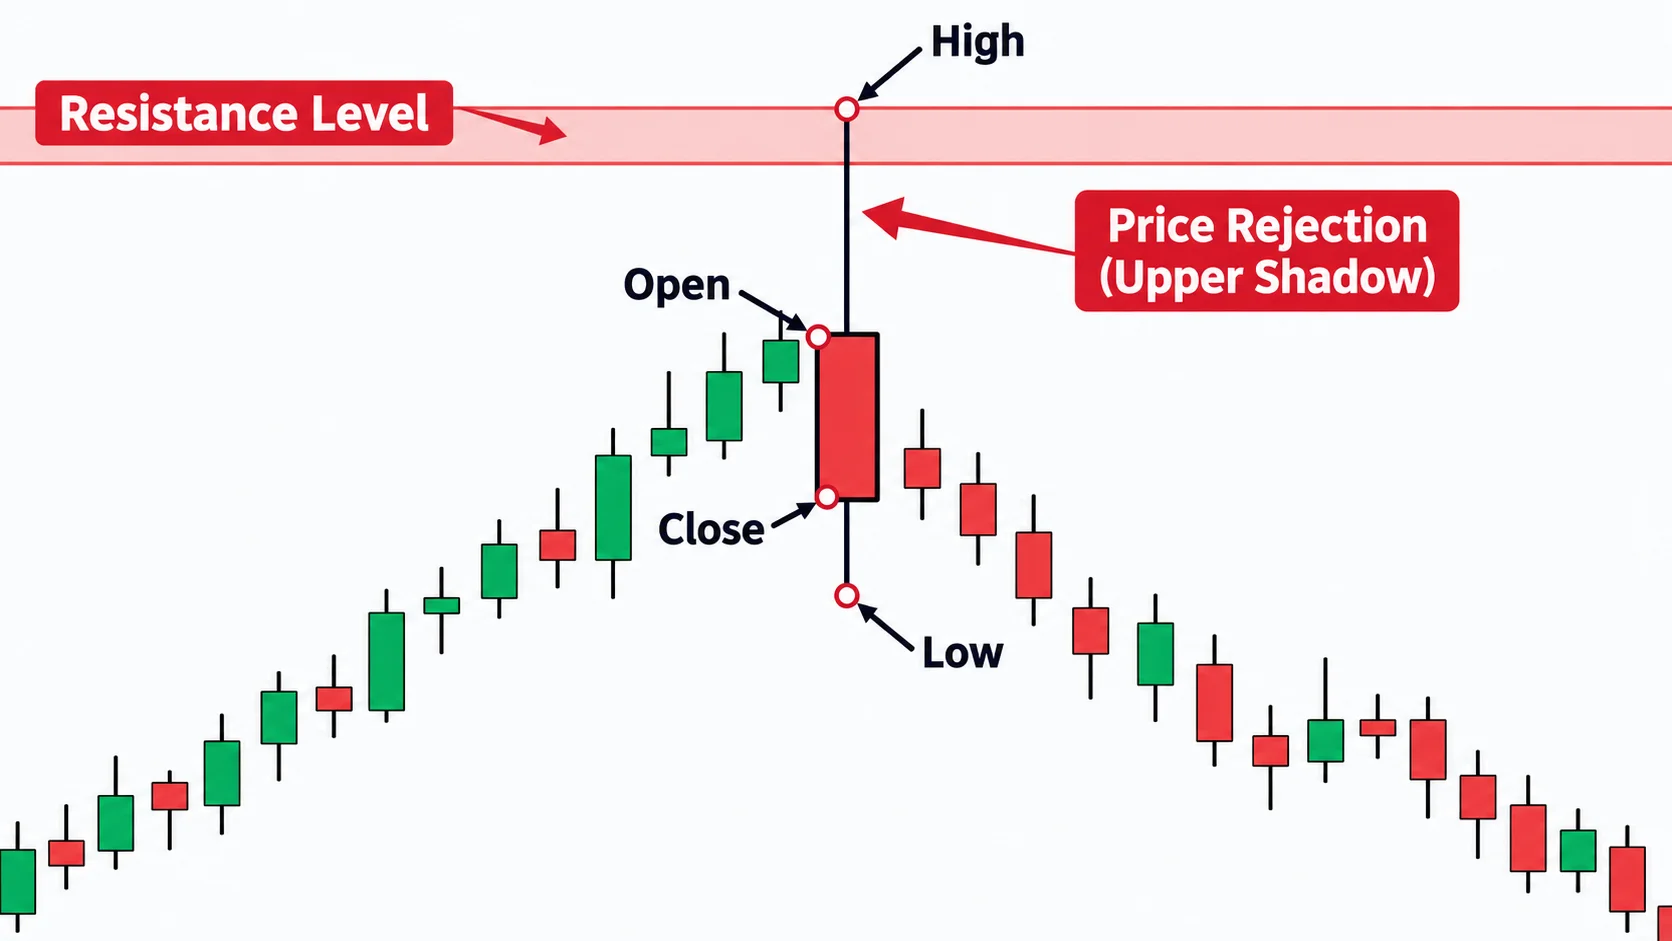
A long upper shadow at the end of an uptrend is a red flag. It means buyers have no more money to push price up. I remember a trade on AUDUSD years ago. I kept buying because the price was going up. I ignored a long wick at a resistance line. Price fell like a stone. I lost money because I didn't respect the rejection.
When you see a long upper shadow, it means sellers are now in charge. They are selling into the strength. If you see this after a long move up, do not buy. Wait to see if the next candle confirms that the price is falling.
Interpreting Lower Shadows as Institutional Support
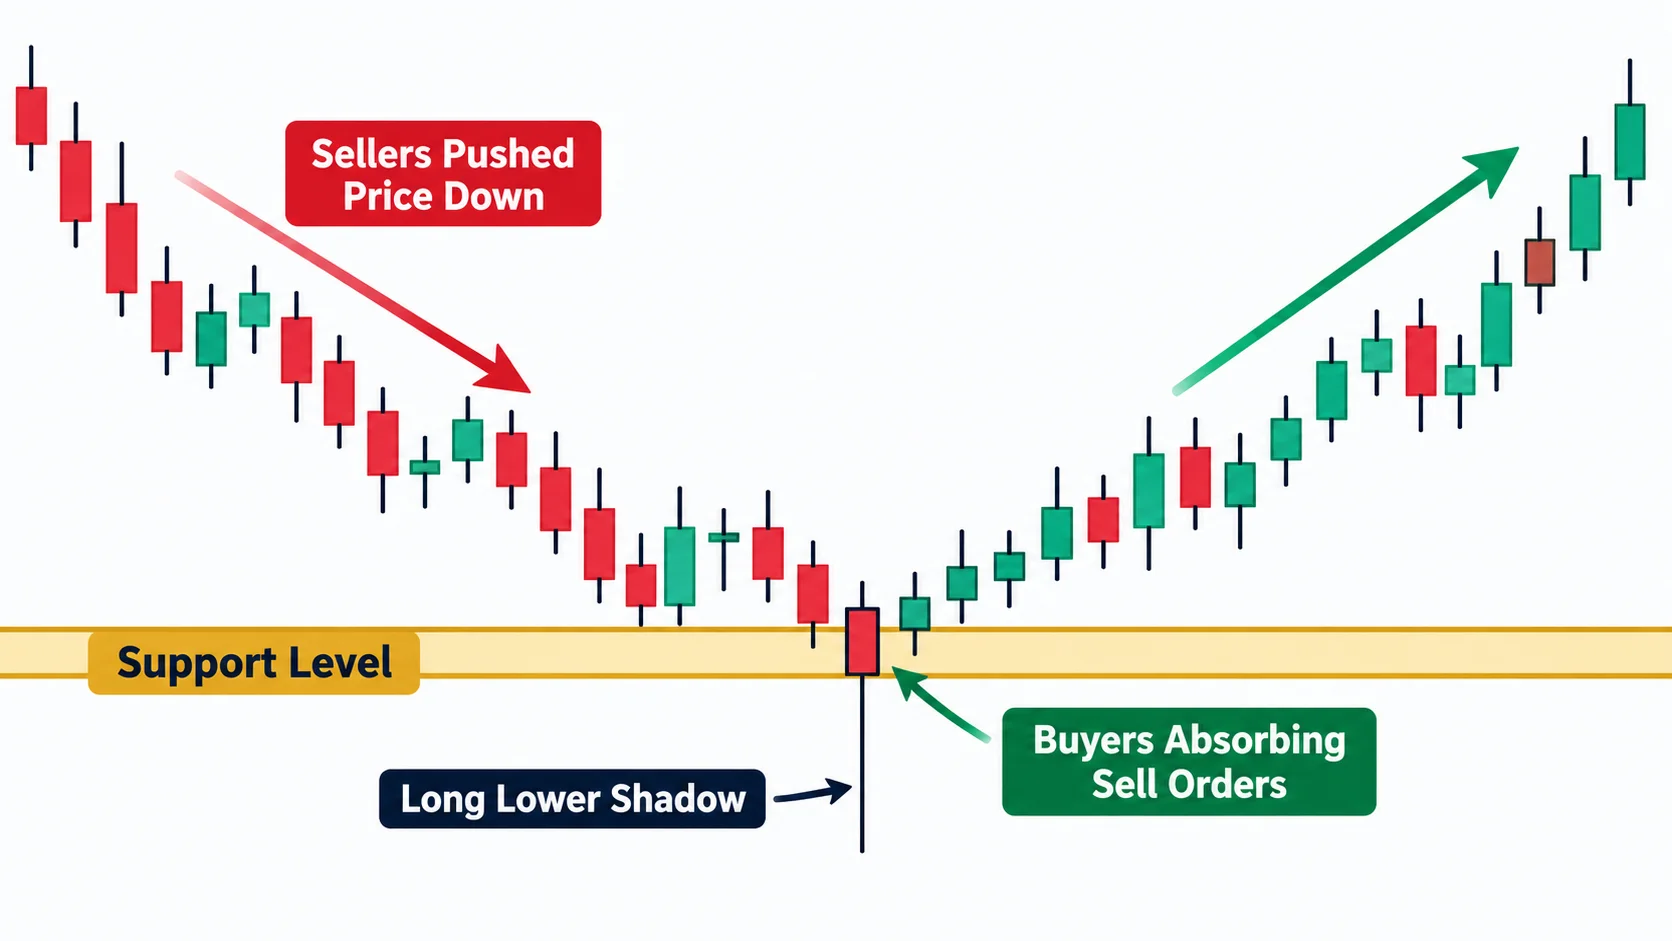
The opposite happens at the bottom of a move. A long lower shadow means big buyers are hiding underneath. Picture the USDJPY pair falling. It hits a round number and stops. Then it jumps back up, leaving a long line at the bottom.
That line is a sign. It shows that big buyers placed orders there to soak up all the selling. They defended that price. When I see this at a support level, I pay close attention. It is a sign that the floor is strong.
What Micro Wicks Reveal on Lower Timeframes
You will see wicks on every timeframe. On a 5 minute chart, most are just noise. But if a 5 minute wick hits a major 4 hour support level, it becomes important. I use this to get a better entry. I see a big wick on a daily chart, then I look at the 15 minute chart to see if price keeps failing to push lower. That gives me the confidence to trade.
The Trap of Trading Every Wick You See
Do not trade every wick. That is a trap. If a wick happens in the middle of nowhere, ignore it. It means nothing. A wick only matters if it touches a real wall, like a support line or a previous high. If you trade wicks in empty space, you are just gambling. You need context.
How to Combine Wicks with Volume and Momentum
A wick is just a hint. You need proof. If you see a long upper shadow at resistance, wait for the next candle to close lower. That is your confirmation.
Take USDCAD. Price hits 1.3650 and leaves a 35-pip upper wick. I wait for the next candle to drift down. I enter a sell. I put my stop-loss above the tip of that 35-pip wick. If price goes above that tip, my idea was wrong. The market proved me wrong, so I get out.
The Risk Management Reality of Wick Trading
Wick trading lets you use tight stops. But be careful. If the wick is 50 pips long, your stop must be 50 pips away. I once put my stop too tight behind a wick on GBPJPY. The price spiked, hit my stop, and then went exactly where I thought it would. It was painful. You must respect the size of the shadow. If the stop is too big for your account, just skip the trade. Never shrink your stop to fit a trade you cannot afford.
I am not your financial adviser, this is only what worked for me.
Where To Read Next
Keep learning with these guides:
How to Trade Bullish Engulfing Candles in Forex (coming soon)
- How to Read Candlestick Patterns for Beginners in Forex
- How to Trade Hammer and Shooting Star Candles in Forex
- How to Trade Bullish and Bearish Engulfing Candles in Forex
- How to Read Bullish and Bearish Candlesticks in Forex
- How to Trade a Pin Bar Candlestick Strategy in Forex
Frequently Asked Questions
How do I read candlestick wicks and shadows to spot forex reversals?
Look for long shadows that hit support or resistance. A long upper shadow at resistance means buyers were pushed back by sellers. This often leads to a price drop.
Why do my stop losses keep getting hit right before price moves my way?
You are likely placing stops at levels everyone else uses. When using wicks, place your stop past the very tip of the shadow. That is the only place it is safe from liquidity hunts.
What is the difference between a wick and a shadow on a forex chart?
There is no difference. They are the same thing. Some people call them wicks, others call them shadows.
How long does a rejection wick need to be to trade it?
It should be at least two or three times the size of the candle body. If it is tiny, it does not show enough rejection to be a reliable signal.
Should I trade every long wick I see on my forex charts?
No. Only trade wicks that happen at important levels like support or resistance. If the wick is in the middle of a messy market, ignore it.
Found this helpful? Share it with someone who needs it.