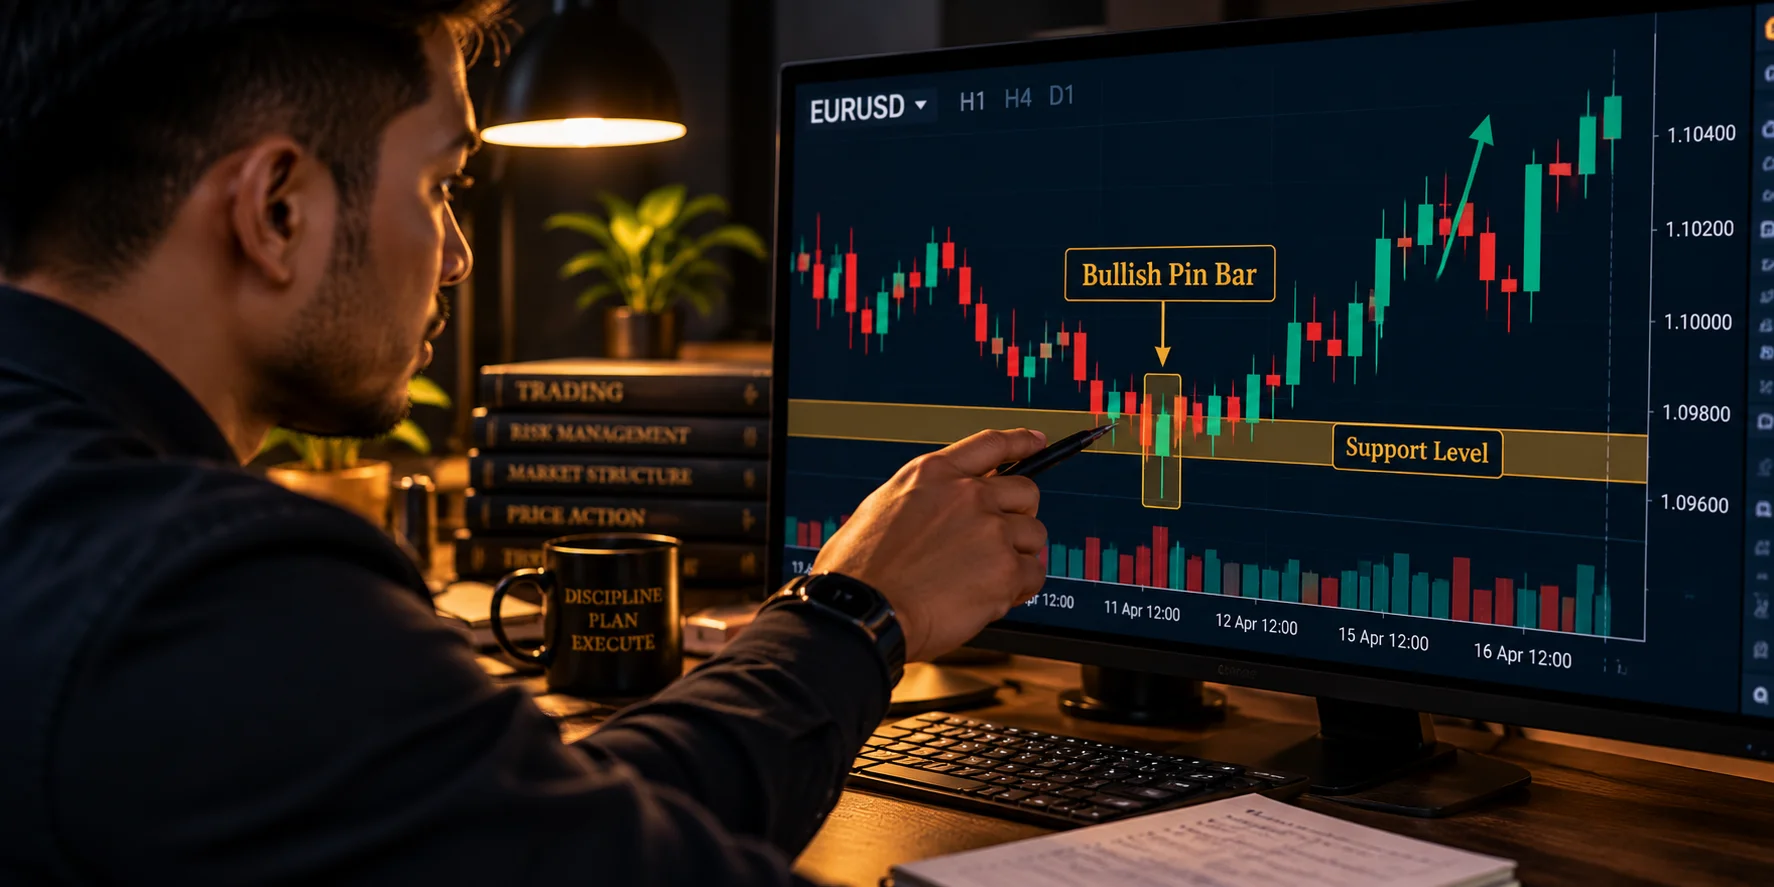
Why Long Wicks Trap Retail Traders
Many new traders get excited when they see a single candle with a long tail on their chart. They think they have found a secret way to print money. Let me tell you, that is usually the moment the market hits their stop loss. A stop loss is a price level you pick to close your trade automatically if it starts losing money. It keeps you safe from losing your entire account.
I remember my own early days. I would see a long wick, think it was a perfect signal, and jump in immediately. But the price would move right through my level and stop me out every single time. It felt like the market was watching me. It was not the market watching me; it was just me trading the shadow instead of the real structure of the market. See, a wick is not just a line on a screen. It is a record of a fight. When you see a long wick, it means one side tried to move the price and was pushed back by bigger players.
The market is like a busy marketplace where buyers and sellers are always haggling over the price of goods. If the price of bread drops too low, shop owners will start buying it up because it is a bargain. That makes the price jump back up. The long wick is just the trail left behind by that big push. Most traders get trapped because they do not look at the context. They see the shape and guess the direction. But the big banks often need to push the price past that wick to hit the orders of retail traders. They do this to collect enough buyers or sellers to fuel a really big move. If you do not understand where that wick is sitting in the grand scheme of the chart, you are just walking into a trap. Before you get into the patterns, you need to understand the basics of reading candlestick patterns.
What the Hammer Candle Actually Tells You
A hammer is a candle with a small body at the top and a long tail, or wick, underneath. It looks like a hammer, which is why we call it that. It tells us that sellers tried to drive the price down, but they ran out of power. Then, the buyers stepped in and pushed the price back up before the candle closed. It is like this: imagine a bus full of people trying to push a heavy gate open. They push and push, but they cannot move it. That is the sellers. Then a huge truck comes and slams into the gate from the other side. That is the buyers. The hammer shows us the moment the truck arrived. However, a hammer in the middle of a blank space on your screen means nothing. It is just a shape. You need to see it at a level where price has stopped before, which we call support. Think of support like a floor that price keeps bouncing off.
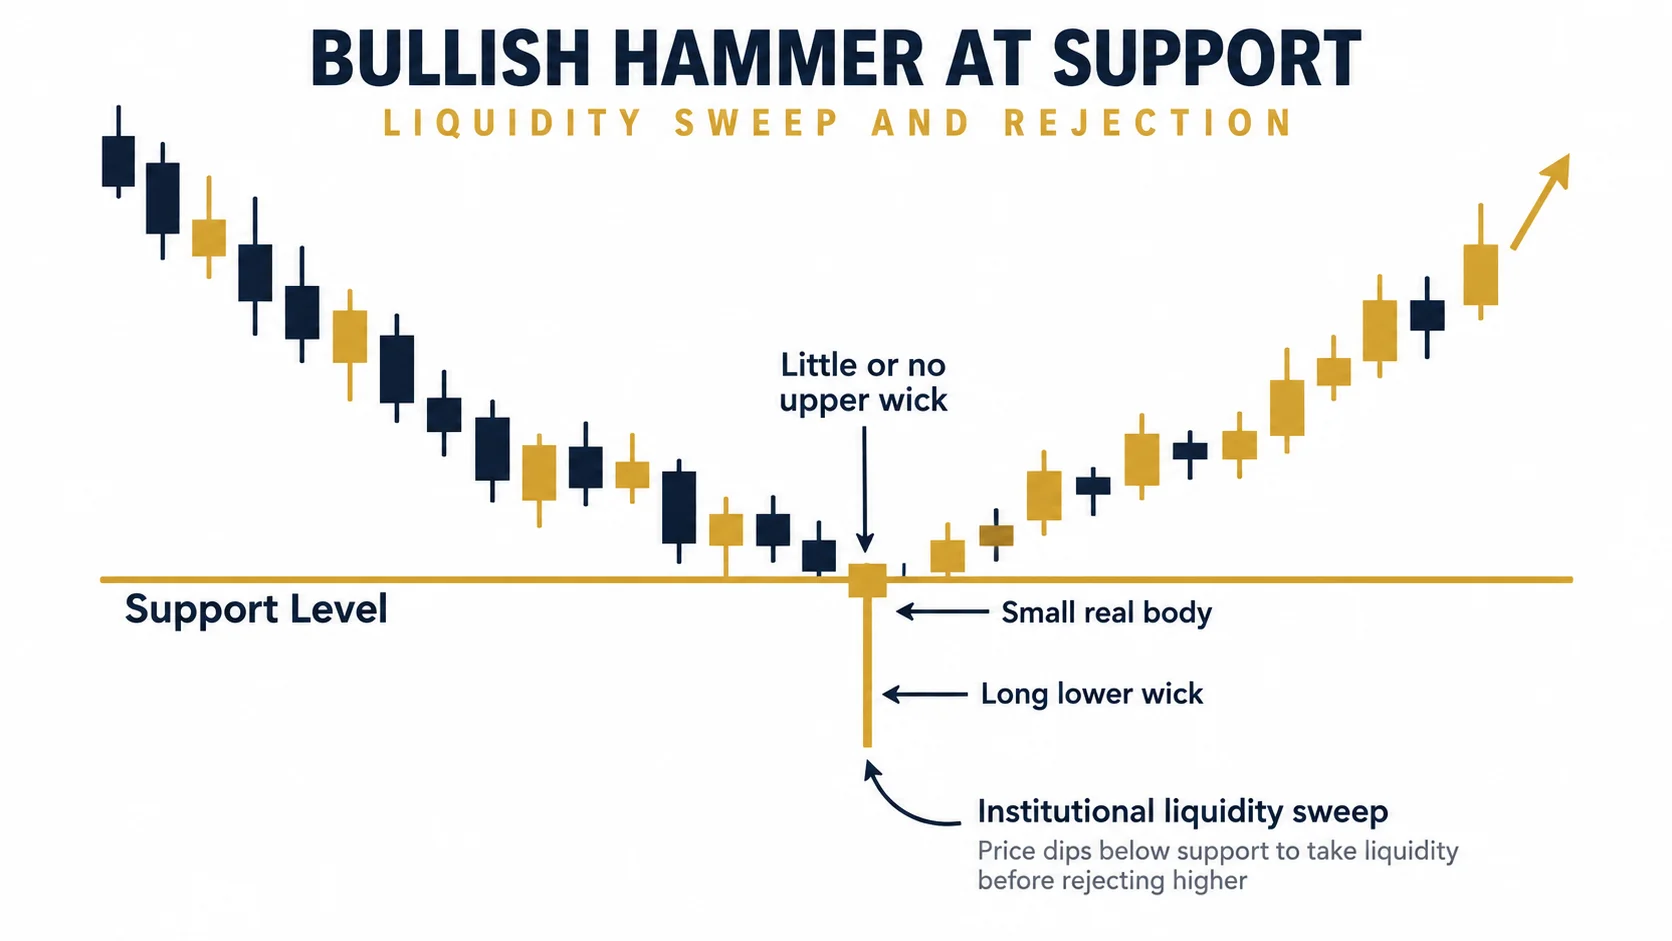
Even me, when I started, I thought every hammer was a winner. I ignored the support lines and just bought whenever I saw the shape. I lost money for months because I did not realize that the location matters more than the shape. A hammer is only a signal when it hits a place where big money is waiting to buy. If you want to master this skill, How to Combine Candlesticks With Support and Resistance will show you exactly how to spot these vital areas on your chart.
Anatomy of a Shooting Star Reversal
A shooting star is just a hammer turned upside down. It has a small body at the bottom and a long wick on top. It shows us the exact opposite of a hammer. Buyers tried to push the price higher, but they hit a ceiling of sellers who were waiting to sell their positions. Those sellers pushed the price back down. We call this ceiling resistance. If a hammer is a floor, a resistance level is a roof. When you see a shooting star at a resistance level, it shows that the buyers are losing their grip. But listen to me: do not sell the moment you see the wick. That is a common mistake. Wait for the next candle to break the low of the shooting star. That confirms that the sellers are actually in control and are not just taking a short break. Think of it like a tug-of-war. The shooting star is the moment the team that was winning starts to slip in the mud. You wait until they actually fall over before you celebrate. If you jump in too early, you might get pulled in with them.
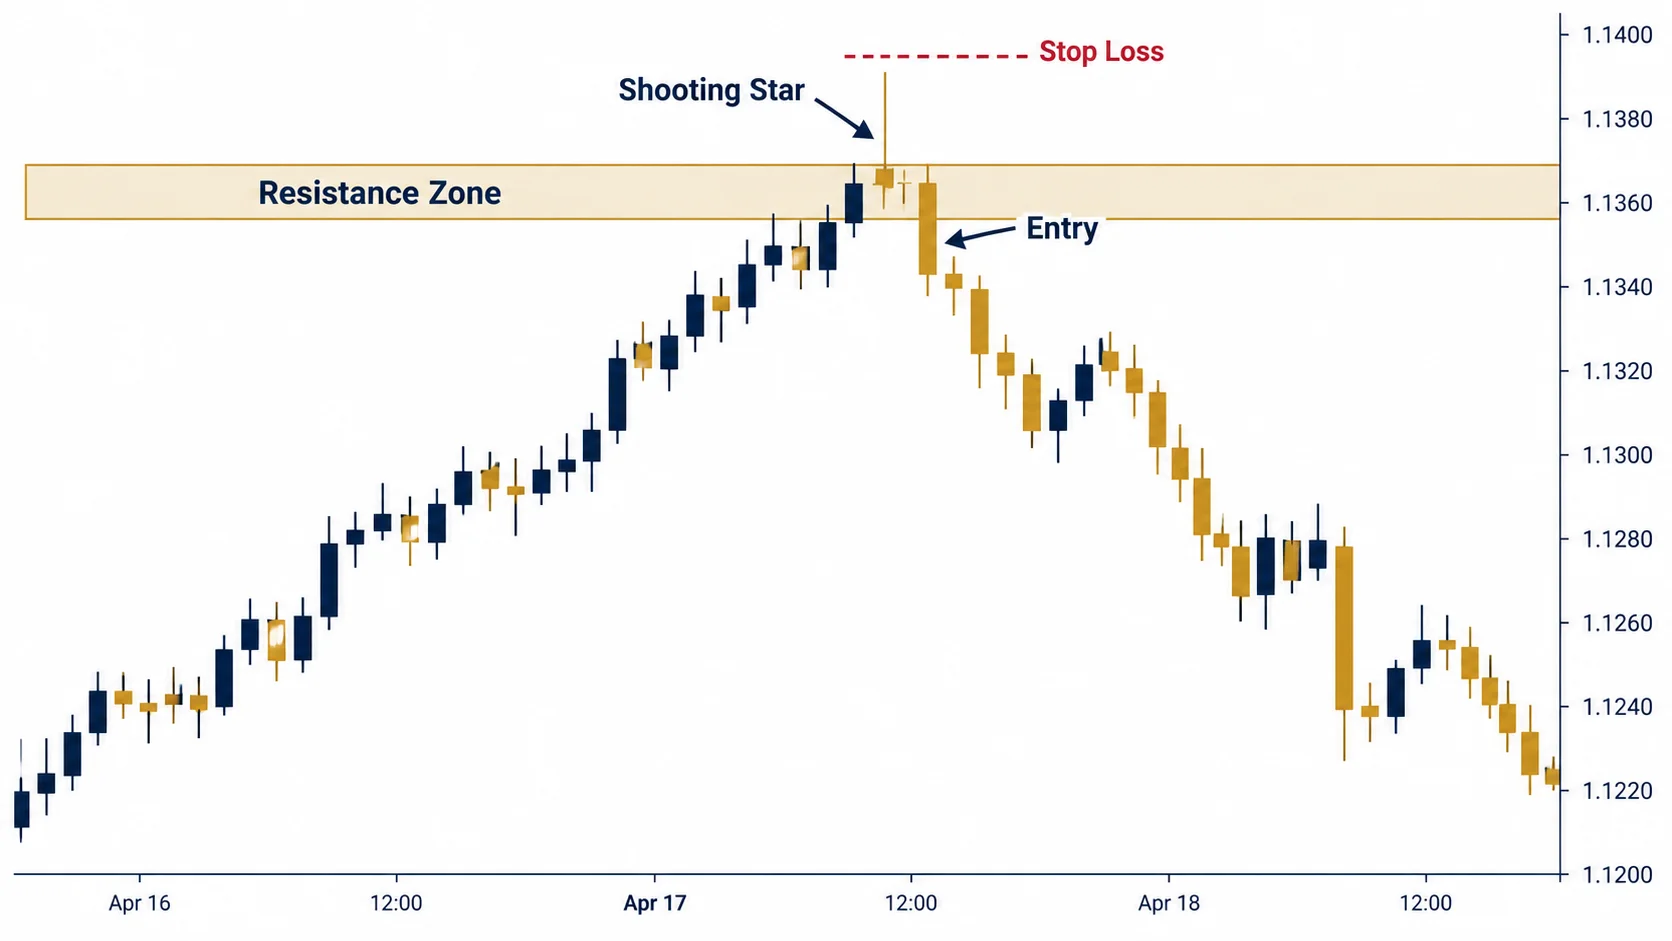
How to Trade These Patterns Without Blowing Your Account
Trading is not about guessing the top or the bottom. It is about how you manage your risk. Remember the story I told you about how I used to move my stop loss? I would place it too close, and the market would hit it just to clear out the orders before moving in my direction. It hurt because I was right about the move, but I was wrong about the spacing. You must give your trade room to breathe. Here is how I do it:
1. Find a clear level of support or resistance.
2. Wait for the hammer or shooting star to form right at that level.
3. Wait for the next candle to confirm the move.
4. Place your stop loss a safe distance away.
5. Set your target so you make at least double what you risk.
For example, if I am looking at the EUR/USD pair, I might see a hammer on the 1 hour chart at a support level. I see the wick is 20 pips long. I would put my stop loss about 5 to 10 pips below that wick. If I am risking 30 dollars on the trade, I want to aim for a profit of 60 dollars. That is a 1:2 reward ratio. You see? You want to make more when you win than you lose when you are wrong.
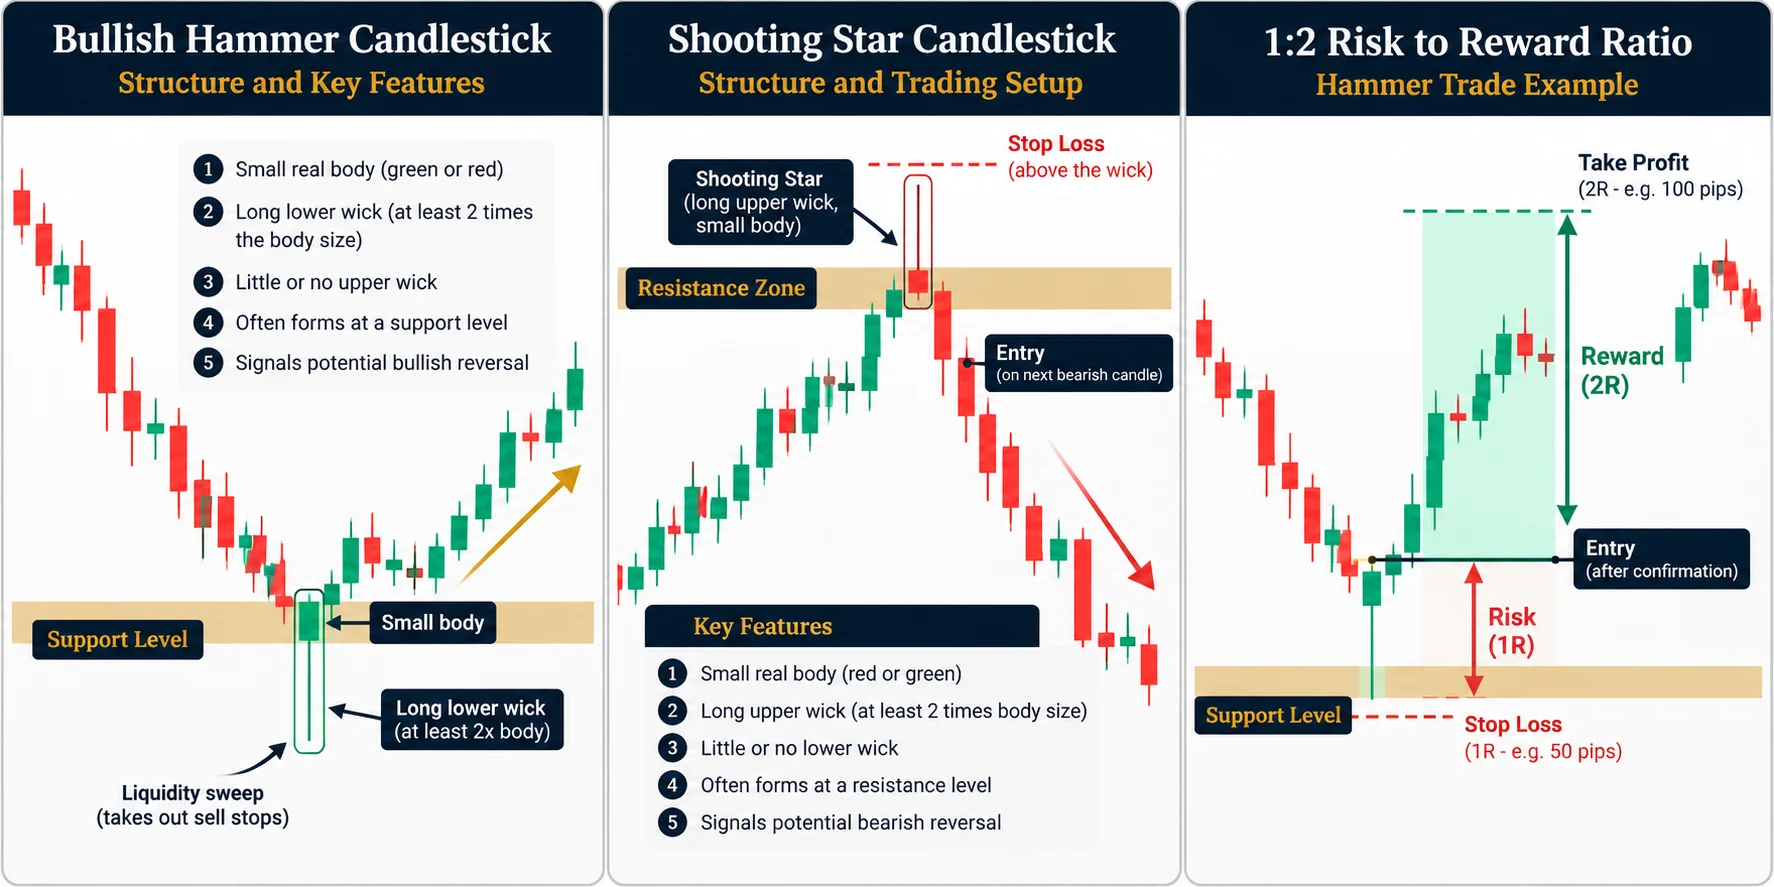
The big secret that experienced traders know is that the trade is not finished until you walk away with your profit or your planned loss. Most beginners get scared and close early, or they get greedy and hold too long. Stick to your plan. I am not your financial adviser, this is only what worked for me.
Why Context Beats Pattern Recognition Every Time
Many people spend all their time learning twenty different candle shapes. Honestly, that is a fast way to lose your money. A hammer in the middle of a very strong downward trend is often just a small pause. The sellers are just catching their breath before pushing the price lower again. You have to look at the bigger picture. Are you trading with the main trend or against it? If you trade a hammer against a very strong trend, the odds are against you. But if you trade that same hammer after the price has hit a major floor, the odds shift in your favour. Before you try to trade every candle you see, you should understand how inside bar breakouts work, or look at how to identify pin bar setups as these are very similar to what we are discussing here. When I started, I used to ignore the trend. I would see a shooting star and think, "Aha! Time to sell!" even if the trend was clearly pointing up. I was fighting the river. You cannot win against the current. Always ask yourself: "Is the market currently trending or ranging?" If you are not sure, checking if a market is trending or ranging will save you from taking bad trades.
Keeping Your Risk Under Control
The most important part of trading is not the candle. It is the size of the position you take. If you trade with a lot size that is too big, one single hammer candle will not save you. You need to understand the meaning of lot sizes in forex so you do not gamble with money you cannot afford to lose. I remember once I had a small account and I went "all in" on a hammer candle. I was so sure it would win. But the market dipped a little bit, hit my stop, and I lost a huge chunk of my account in one go. I felt sick. I had to stop trading for two weeks to clear my head. Now, I always use a small, fixed percentage of my account for every trade. This way, if I lose, it is just a small, manageable amount. If you are just starting out, keep your risk very low. You might want to read about using the 1 percent risk rule. It is the best way to make sure you stay in the game long enough to actually learn. Remember, the market will be there tomorrow. There is no need to rush.
How to Spot Market Traps
Sometimes, you will see a hammer that looks perfect, but it fails immediately. Why does this happen? Often, it is because there was too much liquidity sitting right below that candle. Liquidity is just a fancy word for orders. If there are many stop-loss orders sitting under a support level, the market often likes to dip down to trigger those orders before it moves up. It is like when you go to a shop and they offer a discount for one hour only. They want to get as many people inside the store as possible. The market does the same. It pushes the price lower to "buy" the orders of retail traders who are selling.
Then, with all those orders collected, it has enough fuel to reverse. To avoid this, I always look for a small "sweep" of the lows. If the wick of my hammer goes a little bit below the previous low and then snaps back up, I feel much better about the trade. That tells me the market has taken the liquidity it wanted and is now ready to move. This is a subtle skill, but it is one that I learnt after losing far too many trades. It is the difference between guessing and reading what the big players are actually doing.
Putting It All Together
So, let us recap. A hammer or shooting star is just a sign that the market is hitting a wall. It is a sign of a fight. You use these candles to confirm that your level of support or resistance is holding up. You wait for confirmation. You keep your risk small. And most importantly, you trade with the trend, not against it. If you find yourself getting confused, take a step back. Look at the chart on a higher timeframe, like the 4 hour chart. The noise is lower there, and the signals are usually much clearer. If you want to master even more powerful signals, How to Trade Bullish and Bearish Engulfing Candles in Forex shows you how to spot the bigger market moves.
Do not force trades. If the market is not giving you a clear setup, do not trade. Sitting on your hands is a valid trading strategy. I hope this helps you look at your charts with new eyes. It is not about finding the perfect signal. It is about being patient and waiting for the market to show you its hand. Keep practising, keep your risks small, and remember that we are all learning this together.
Where To Read Next
If you want to keep learning, these are the ones I would read next.
- How to Read Candlestick Patterns for Beginners in Forex
- How to Trade Bullish and Bearish Engulfing Candles in Forex
- How to Read Bullish and Bearish Candlesticks in Forex
- How to Trade a Pin Bar Candlestick Strategy in Forex
- What Are Morning and Evening Star Patterns in Forex?
Frequently Asked Questions
What is the best way to trade hammer and shooting star candles in forex?
The best way is to wait for them to form at a clear level of support or resistance. Never trade them in the middle of nowhere. Wait for the next candle to close in your direction before you enter the trade.
Why do my stop losses keep getting hit right after I trade a hammer candle?
Your stop loss is likely too close to the wick. Big banks often push the price through that wick to grab liquidity before moving the other way. Give your trade a little more space below the wick.
How do I know if a hammer candle is valid or a fakeout?
A valid hammer must be at a proven technical level where price has reacted before. If the candle is just floating in the middle of a trend without hitting a level, it is likely a trap or a fakeout.
What is the difference between a hammer and a shooting star?
A hammer has a long wick at the bottom and appears at the end of a downward move, showing that buyers are taking control. A shooting star has a long wick at the top and appears at the end of an upward move, showing that sellers are taking control.
Can I trade hammer and shooting star patterns on a 5-minute forex chart?
You can, but it is very difficult because there is a lot of market noise. You will usually find more reliable signals on the 1-hour or 4-hour charts where the market structure is clearer.
I am not your financial adviser, this is only what worked for me.
Found this helpful? Share it with someone who needs it.