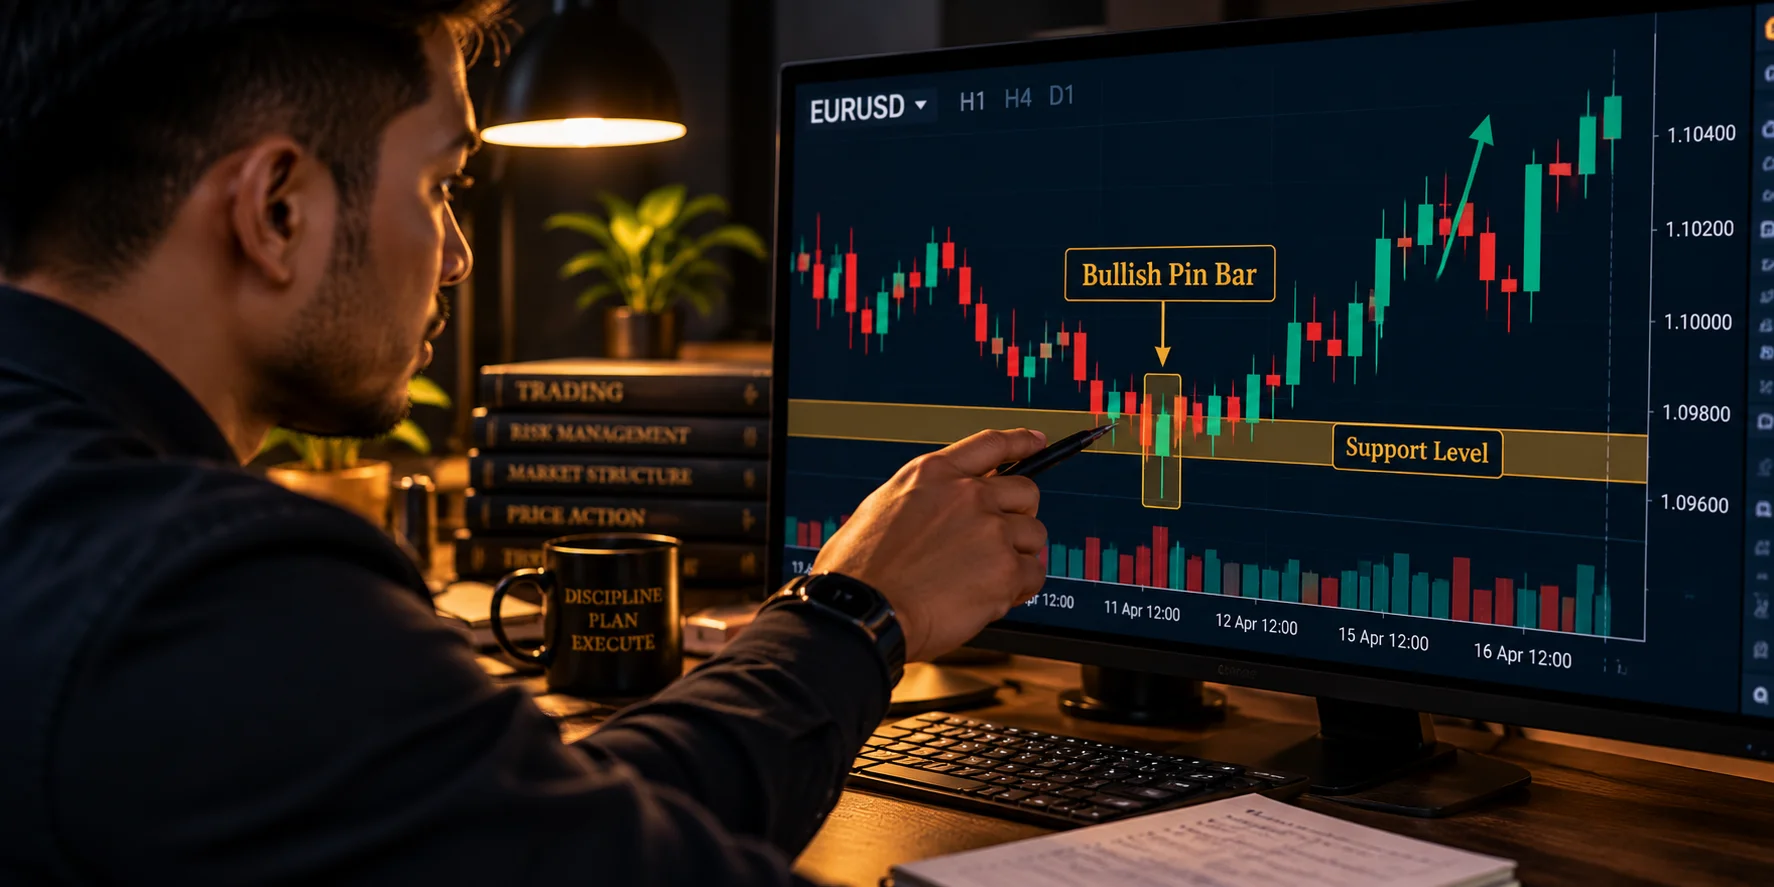
Many traders look at one candle and hope it tells the future. It never does. The market does not care about one candle. It cares about extremes. It cares about where the buyers or sellers finally gave up.
This is where tweezer tops and bottoms come in. These are just names for two candles that end at the same price. It shows that price hit a wall and could not go further.
So What Actually Happens When Price Reverses on the Same Level?
Before you look at these, you must know how candles form. A tweezer is not just a shape. It is a sign of rejection.
Imagine the 4 hour chart for GBPUSD. The price goes up. It hits 1.3000 and leaves a long wick as sellers push it back down. A wick is the thin line showing where price went but did not stay. Then, the next candle pushes up to 1.3000 again. It fails again. This is a tweezer top.
It means no buyers were willing to pay more than 1.3000. Big players were selling there. When you see two candles end at the same spot, you are looking at a brick wall of orders. Back then i used to think these were just lucky patterns. I was wrong. They are footprints of big money.
How to Spot Tweezer Tops on a Live Forex Chart
A tweezer top is a bearish signal. It shows the end of an uptrend. You need two candles with the exact same high.
The first candle is green. It shows buyers are in charge. The second candle opens, goes up to the same high, and then fails. It closes red. The bodies of the candles do not have to look the same. The only thing that matters is the high. That high is the ceiling.
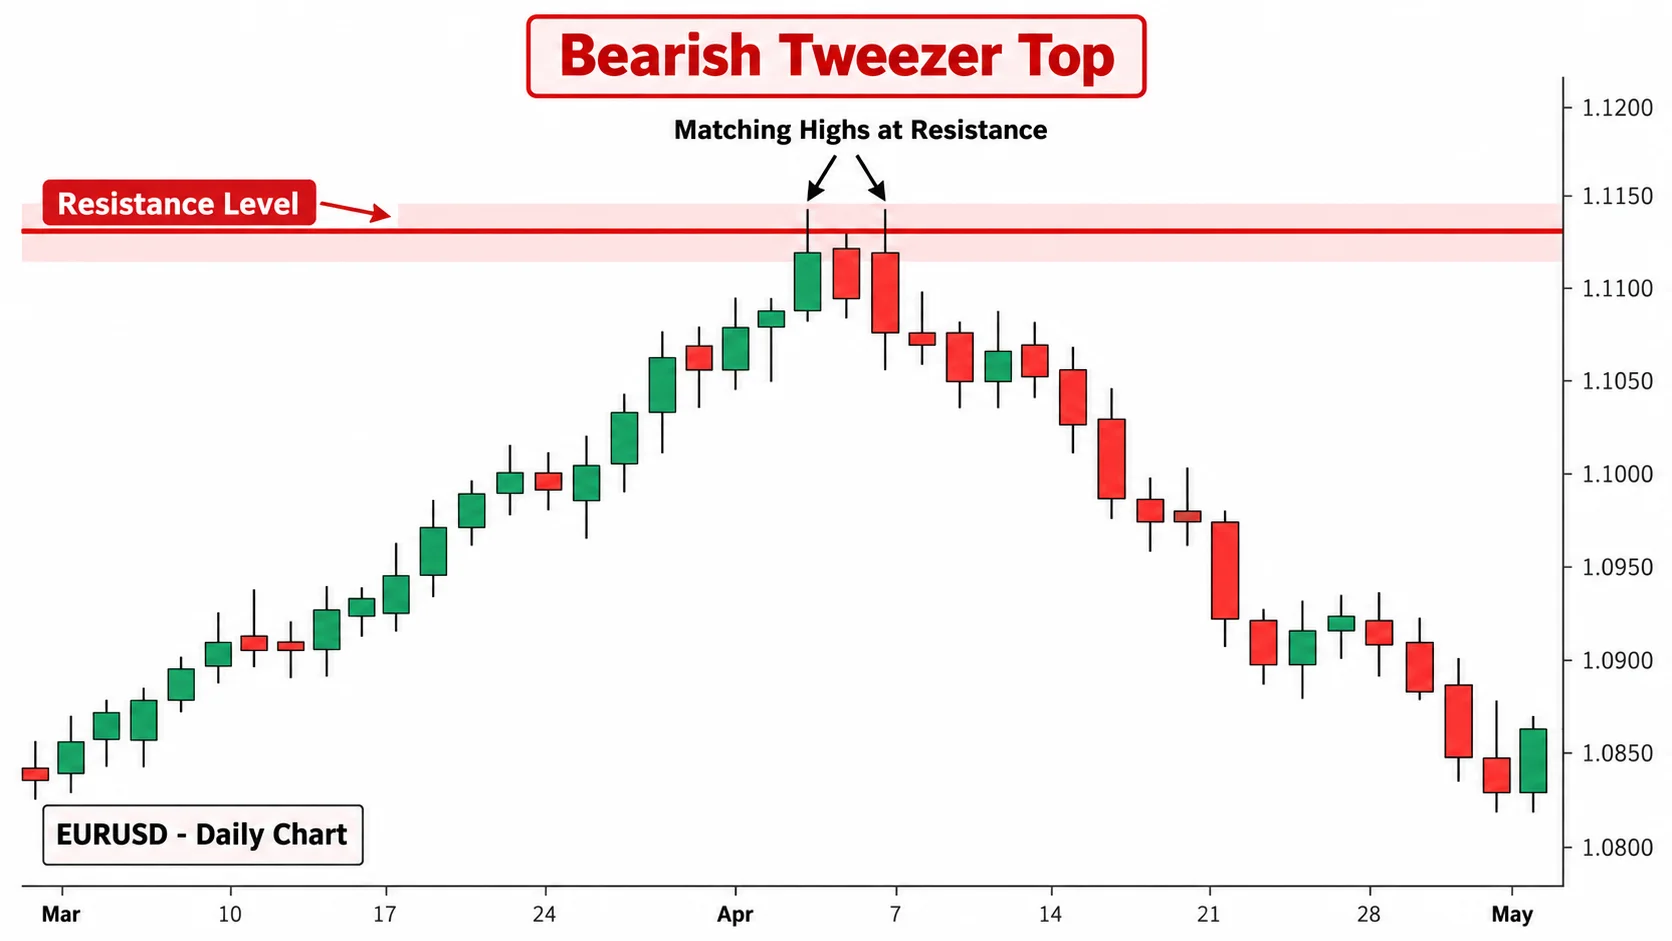
If you see this on a daily chart for EURUSD, it carries weight. It means buyers tried twice to break out and failed. Short sellers will now pile in. They put their stop losses above that high.
How to Spot Tweezer Bottoms When the Market Dips
A tweezer bottom is the opposite. It is a bullish signal at the end of a downtrend. The price drops. The first candle is red. The second candle hits the same low as the first and then buyers push it back up.
The matching low is the key. It means sellers tried to push lower twice and found no one left to sell to. I once traded a tweezer bottom on USDJPY because the chart looked perfect, but the problem was that ignored the news. A big report came out five minutes later, and the price crashed right through my level. I learned that day that a pattern is not a forcefield against news.
Never trade these alone. If the big trend is down, a small tweezer bottom is just a tiny break before more selling.
The Mistake Most Retail Traders Make With Tweezer Patterns
Most people treat these patterns like a cheat code. They see the shape and click buy or sell. This is how you lose money.
The pattern is not the reason to trade. The location is. A tweezer top in the middle of nowhere is just noise. It means nothing. But a tweezer top at a major weekly resistance level? That is a real signal. "The market does not reward you for recognising a pattern. It rewards you for understanding who is trapped."
Ask yourself: who is losing money if this price does not move past this line?
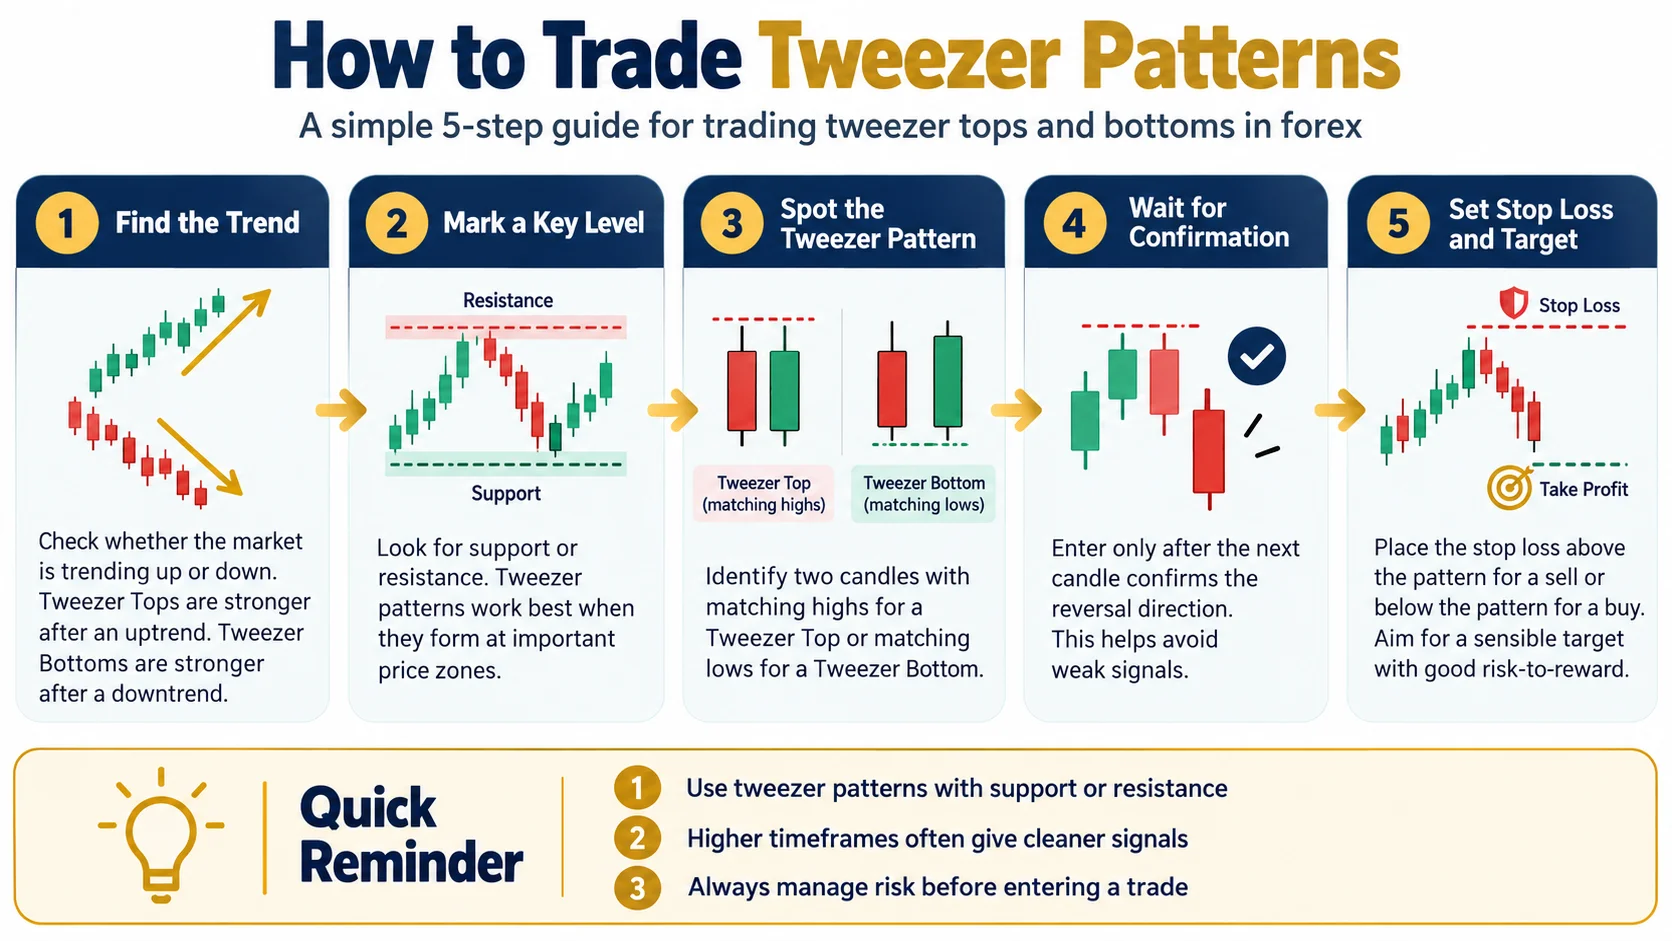
Step by Step Guide to Trading Tweezer Tops and Bottoms
Here is how I trade them safely.
Find a major level on the 4 hour or daily chart.
Wait for price to test it twice to form the tweezer.
Look for a sharp, fast rejection on the second candle.
Enter after the second candle closes.
Put your stop loss a bit past the wick.
For example, if you risk 1% of your account on a trade, you might put a stop loss 20 pips past the wick. If the trade works, aim for 60 pips. A pip is the tiny unit of price change. If you do not give the trade room to breathe, a small spike will kick you out of a good move.
Why Context Matters More Than the Pattern Itself
I once took a perfect tweezer top on a cross pair. I felt like a genius. Then, a surprise news event happened, and the market ignored my technical level completely. I was stopped out in seconds.
I learned to check the economic calendar first. If the banks are about to speak, stay away. Your chart is the map, but the news is the weather. You do not want to be out in a storm.
Where To Read Next
If you want to understand how price moves, read this guide.
How to Trade Bullish Engulfing Candles in Forex (coming soon)
How to Trade Hammer and Shooting Star Candles in Forex (coming soon)
Why Do Candlestick Patterns Fail Without Context in Forex (coming soon)
- How to Read Candlestick Patterns for Beginners in Forex
- How to Trade Hammer and Shooting Star Candles in Forex
- How to Trade Bullish and Bearish Engulfing Candles in Forex
- How to Read Bullish and Bearish Candlesticks in Forex
- How to Trade a Pin Bar Candlestick Strategy in Forex
Frequently Asked Questions
What are tweezer tops and bottoms in forex trading?
They are patterns where two candles stop at the same high or low. It shows the price hit a wall and could not go further.
Why do my stop losses keep getting hit on tweezer patterns?
You are likely placing them too close. Big players often push price slightly past a level to trigger stops before moving the other way. Give your trade an extra 5 or 10 pips of space.
How do I know if a tweezer top is a fakeout?
If it happens when volume is low or in the middle of a messy range, it is likely a fakeout. A real signal happens at a major price level with a strong, fast rejection.
Can I trade tweezer patterns on a small forex account?
Yes. Just make sure your position size is small enough. If you have a small account, risking 1% of it per trade keeps you in the game even if you are wrong.
Should I trade tweezer patterns on 5-minute charts?
No. Lower timeframes are full of noise and random moves. Stick to the 4-hour or daily charts for better results.
Found this helpful? Share it with someone who needs it.