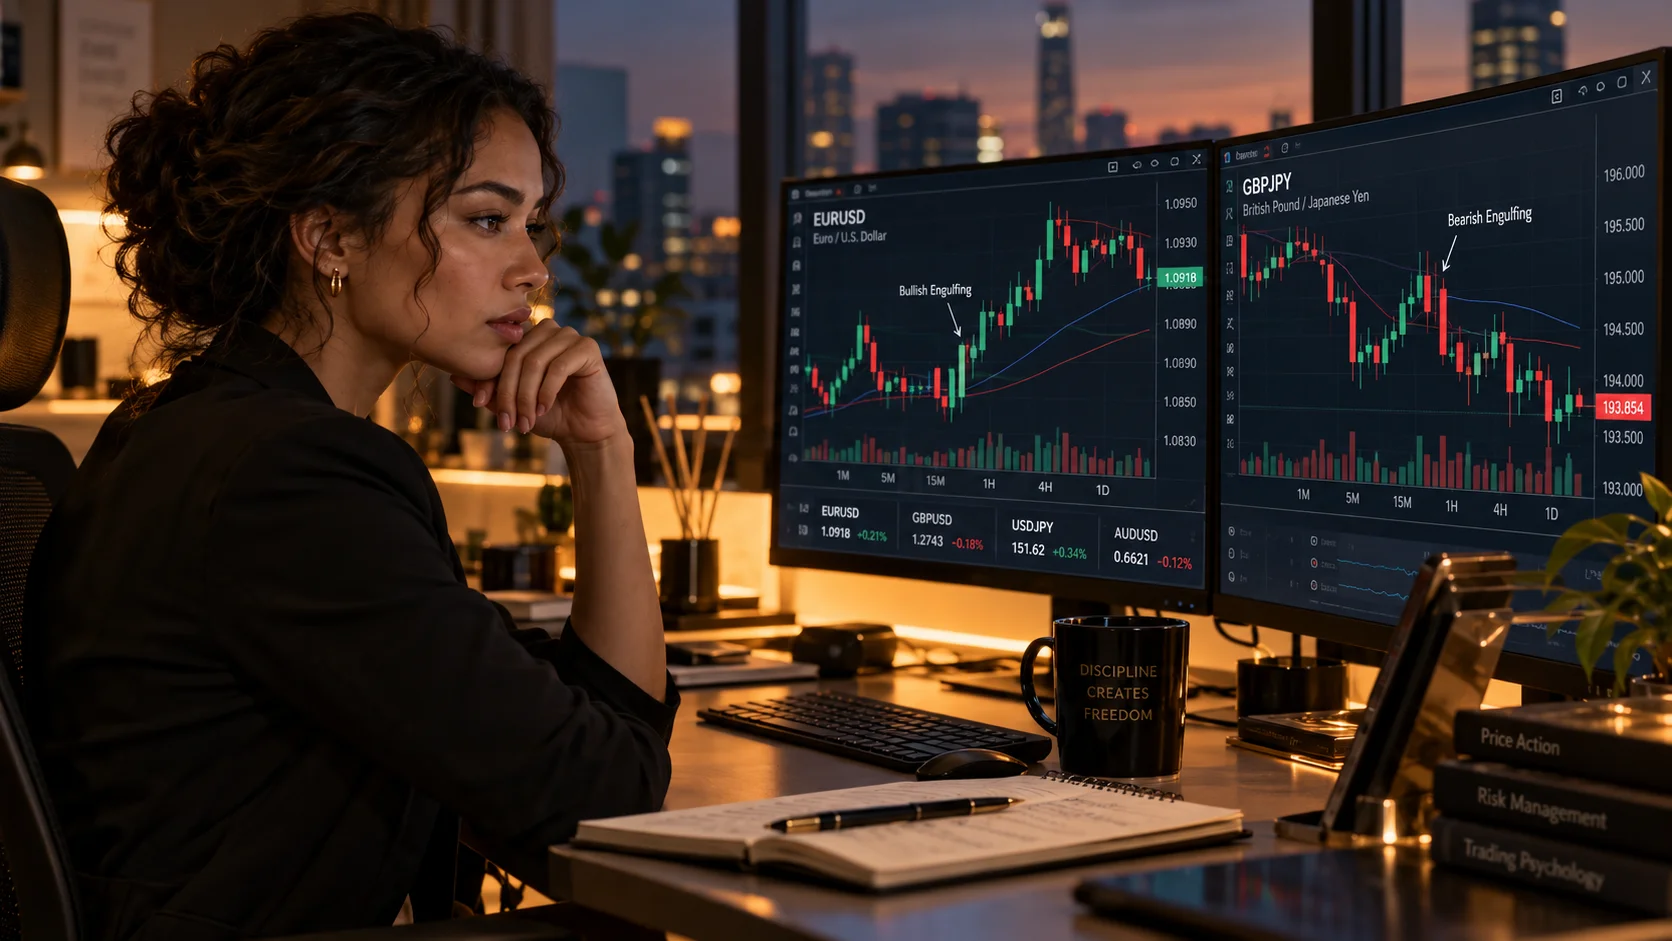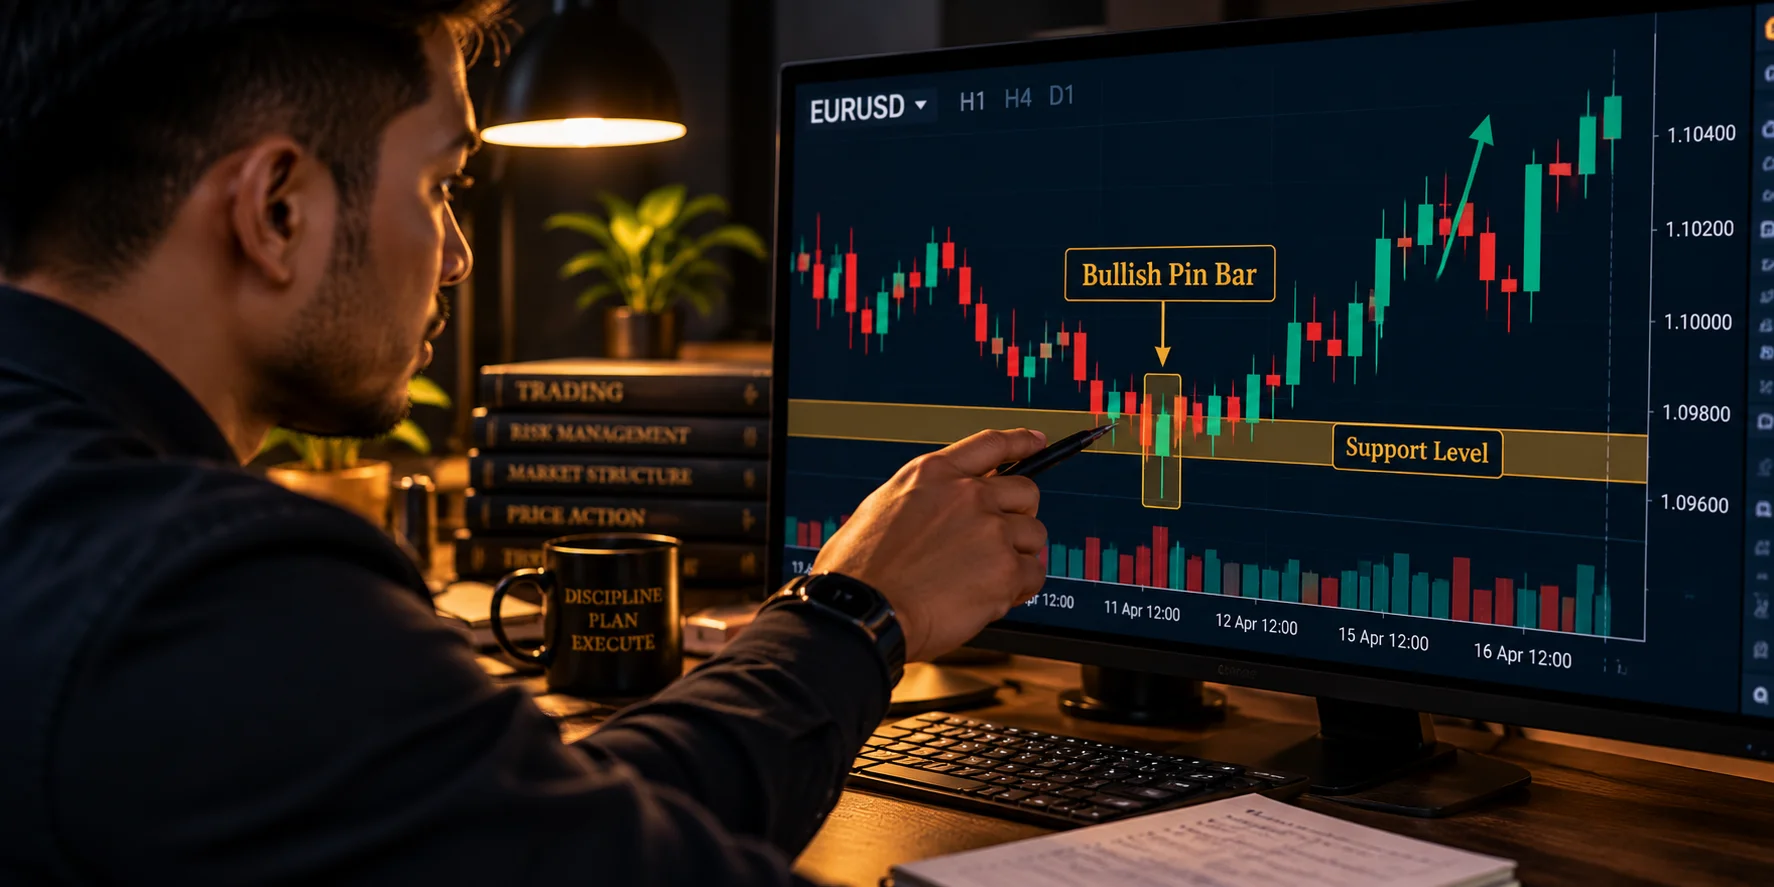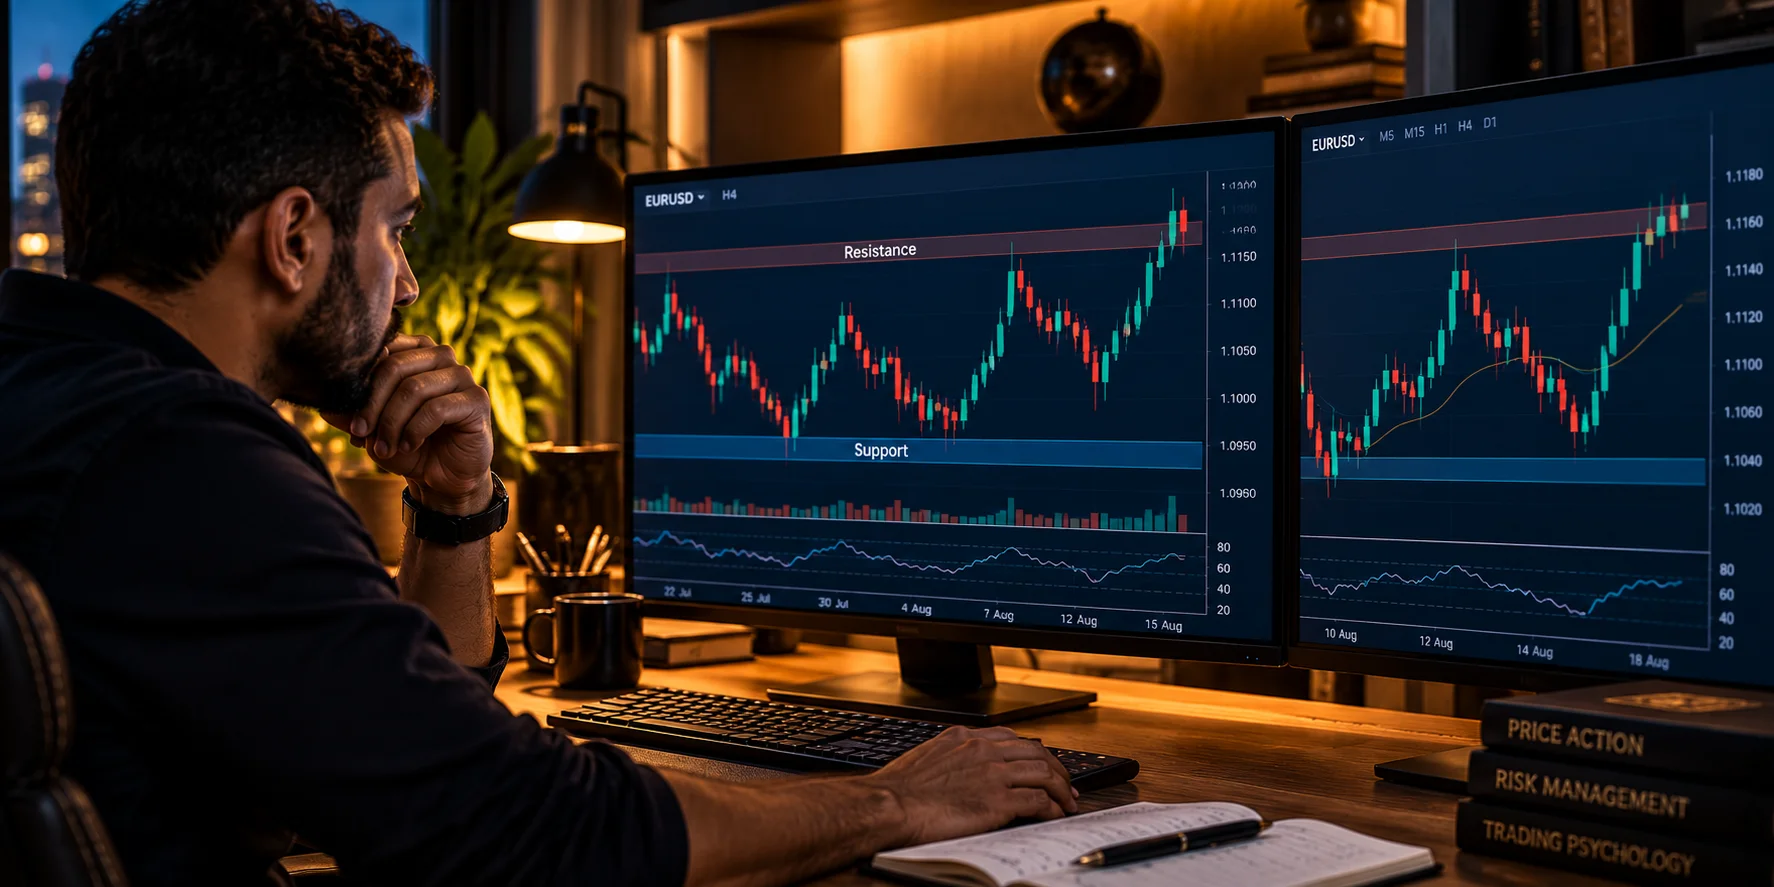
Most traders lose money. They think they need to find the perfect signal. They look at a chart, see a shape, and jump in. But they ignore the most important part. They ignore the context.
Let me tell you about the trap I fell into. I used to hunt for hammer candles. I saw a hammer, I hit buy. Then the price dropped like a stone. My stop loss was hit in seconds. I felt like the market was picking on me. I now know that I was asking the wrong question. I was asking why the shape did not work. I should have asked: why do candlestick patterns fail without context in forex?
So Why Do Candlestick Patterns Fail Without Context in Forex?
Most people treat a candle like a green light at a crossing. They see the shape, they go. But the market does not care about shapes. To understand how to read candlestick patterns, you must see what they really are. A candle is just a history book. It shows where buyers and sellers fought for a set time.
When you see a hammer, it means buyers pushed price up. But why? Was it at a key level where banks have orders? Or was it just in the middle of nowhere? Banks do not trade shapes. They trade where the money is. They look for areas where many people have put their stop losses. If you trade a shape far from any key level, you are trading air. The pattern fails because there is no reason for the price to move there.
The Illusion of the Standalone Signal
When I started, I collected patterns like baseball cards. I had a folder of them. I saw a shooting star on the five minute GBPUSD chart and I sold it instantly. I did this for months. I lost money every single week. I thought I just needed to find a "better" pattern.
The truth was simpler. I was looking at a tiny piece of the puzzle. It is like looking at a drop of water and trying to guess the weather. A single candle does not show you the trend. If the big trend is up, your little "sell" signal will get crushed. I was driving my car by looking at the radio, not the road.
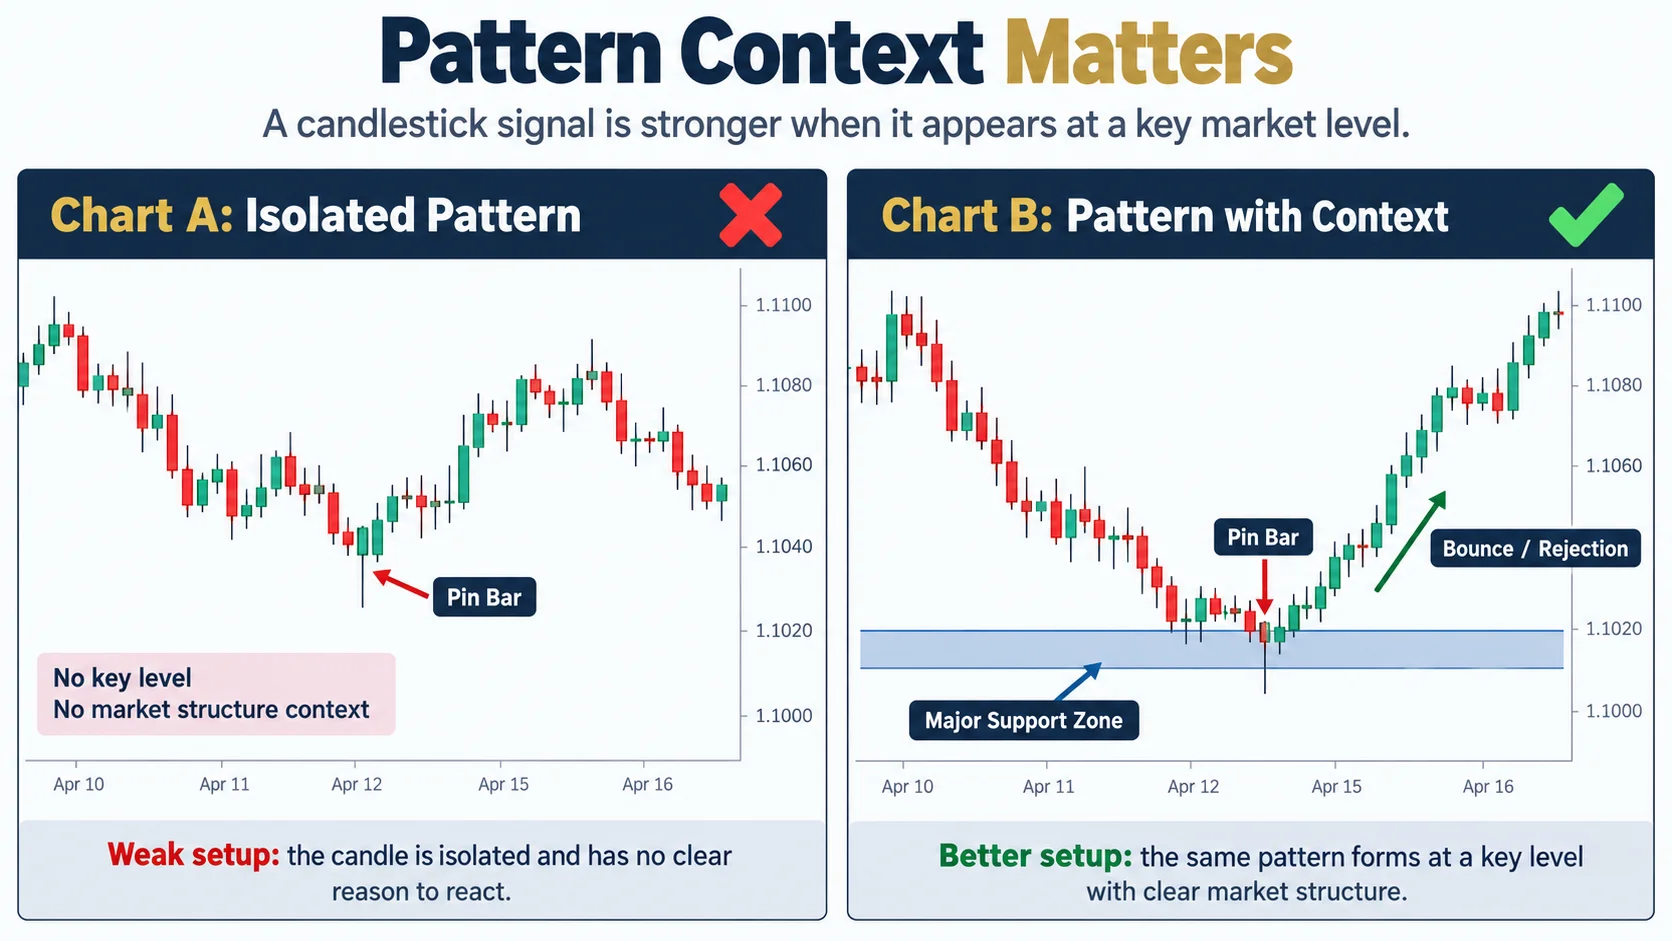
Why Location Trumps Shape Every Single Time
You can have the most perfect engulfing candle in the world. If it happens against the trend, it is a trap. Location is everything. Price respects zones because that is where big money has decided to act.
Think of it this way. When price hits a big support level, many people buy. Big banks know this. They might push the price a little bit lower to "sweep" the stops. This creates a long wick on your candle. If you see that wick and think "it's a reversal," you are wrong. The banks just grabbed the liquidity they needed. They were not reversing; they were filling their tanks. A beginner sees a signal. A pro sees a stop loss hunt.
How Market Structure Changes the Game
Before you look at candles, look at the structure. Is the price making higher highs? That is your bias. A bias tells you if you should look for buys or sells. Once you have a bias, a candle becomes a tool. It is not the signal. It is just your timing.
Follow this flow:
Find the main trend on a big chart, like the four-hour.
Wait for the price to pull back to a key level.
Now, look for your candle pattern.
If the pattern does not match the trend, do not trade it.
You are a detective now. You are building a case.
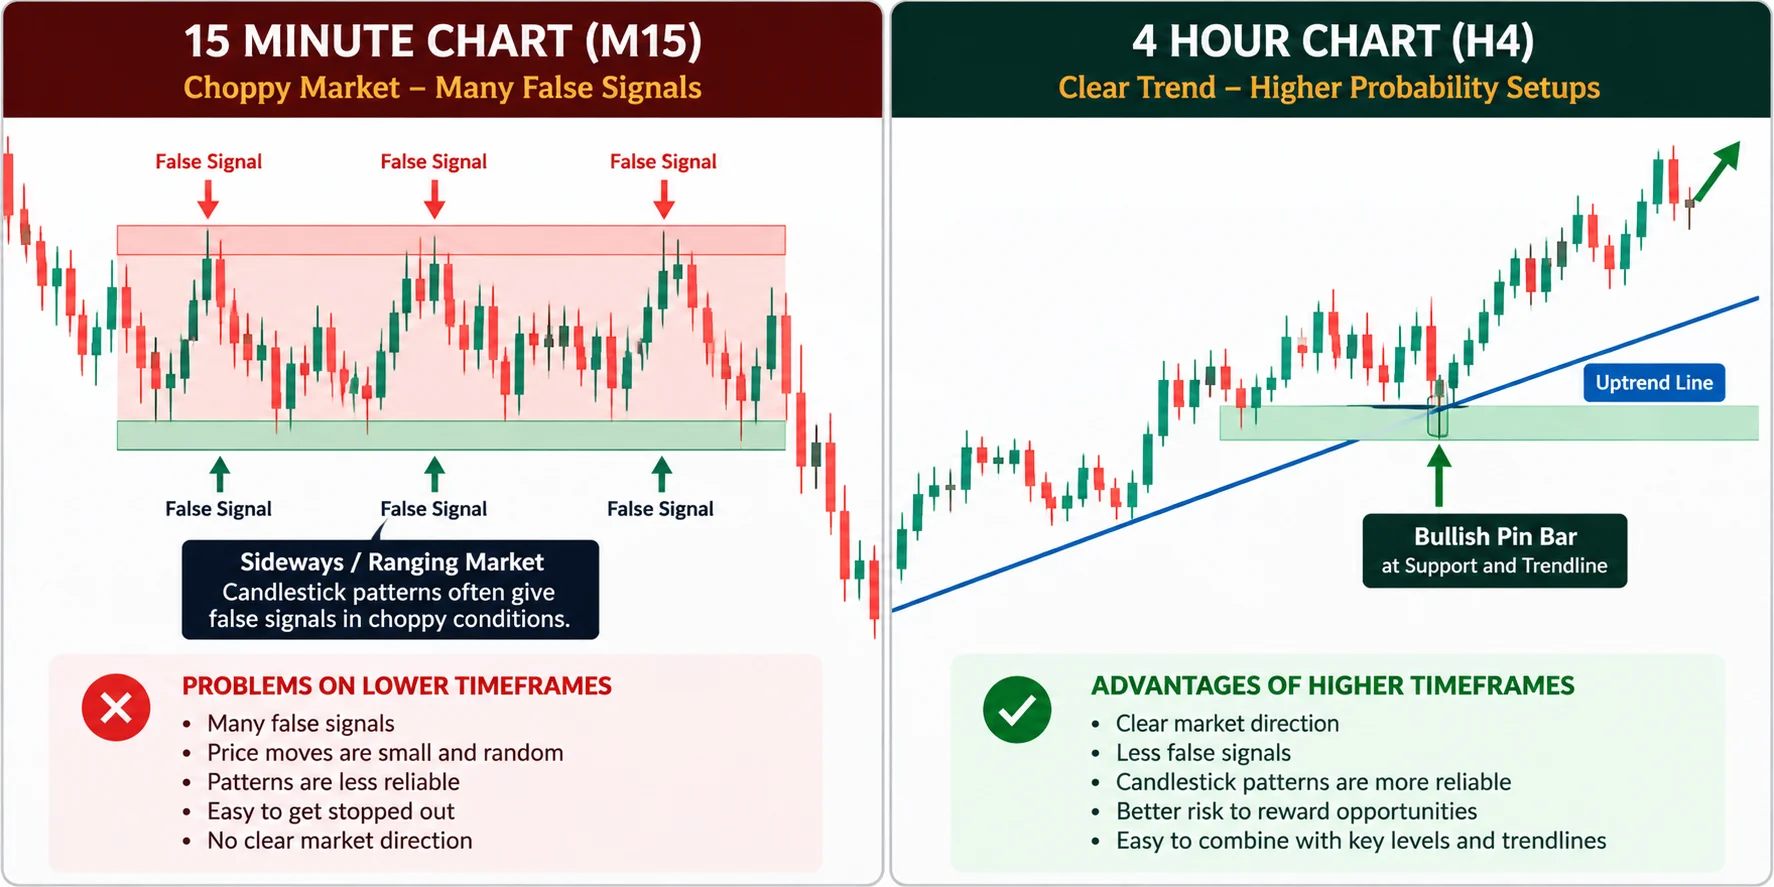
The Danger of Low-Timeframe Noise
Most beginners stay on the one-minute chart. They see a pattern every few minutes. Most of these are fake. They are just random blips. These small charts are full of computer bots fighting for tiny bits of money. You cannot beat them there.
I remember the day I turned off my one minute charts. I moved to the one hour chart. I stopped feeling like I was in a casino. The candles started to tell a real story. I stopped trading noise and started trading the market.
Building a Real Confirmation Checklist
You need a filter. If a trade does not pass, you do not take it. Use this checklist:
Is the price at a known support or resistance level?
Is my trade in the same direction as the big trend?
Is the candle pattern at that level, or is it floating?
Can I place my stop loss in a spot that makes sense?
If you miss one, do not trade. You will take fewer trades, but you will stop losing so much money. That is how you grow.
Where To Read Next
To learn more about how price moves, see these guides:
- How to Read Candlestick Patterns for Beginners in Forex
- How to Trade Hammer and Shooting Star Candles in Forex
- How to Trade Bullish and Bearish Engulfing Candles in Forex
- How to Read Bullish and Bearish Candlesticks in Forex
- How to Trade a Pin Bar Candlestick Strategy in Forex
Frequently Asked Questions
Why do my candlestick patterns fail right before price moves my way?
They fail because you are looking at the shape but ignoring the big picture. You might be entering right where big banks are hunting for stop losses. If you do not check the higher timeframe, you are walking into a trap.
How do I know if a candlestick pattern is valid or just market noise?
It is only valid if it happens at a key level, like a major trend line or a support zone. If it happens in the middle of a messy range, it is usually just noise.
Should I trade candlestick patterns on the 5-minute chart?
It is very hard. There is too much noise and the costs to trade are high. Stick to the one-hour or four-hour charts. It makes things much clearer.
What is market structure context in forex trading?
It is just knowing if the market is going up, down, or sideways. Only trade patterns that agree with that direction.
Can I become a profitable forex trader using only candlesticks?
No. Shapes are not enough. You need to know how to manage your money and how to spot where the big banks are moving. I am not your financial adviser, this is only what worked for me.
Found this helpful? Share it with someone who needs it.