What Does a Doji Candlestick Mean in Forex Trading?
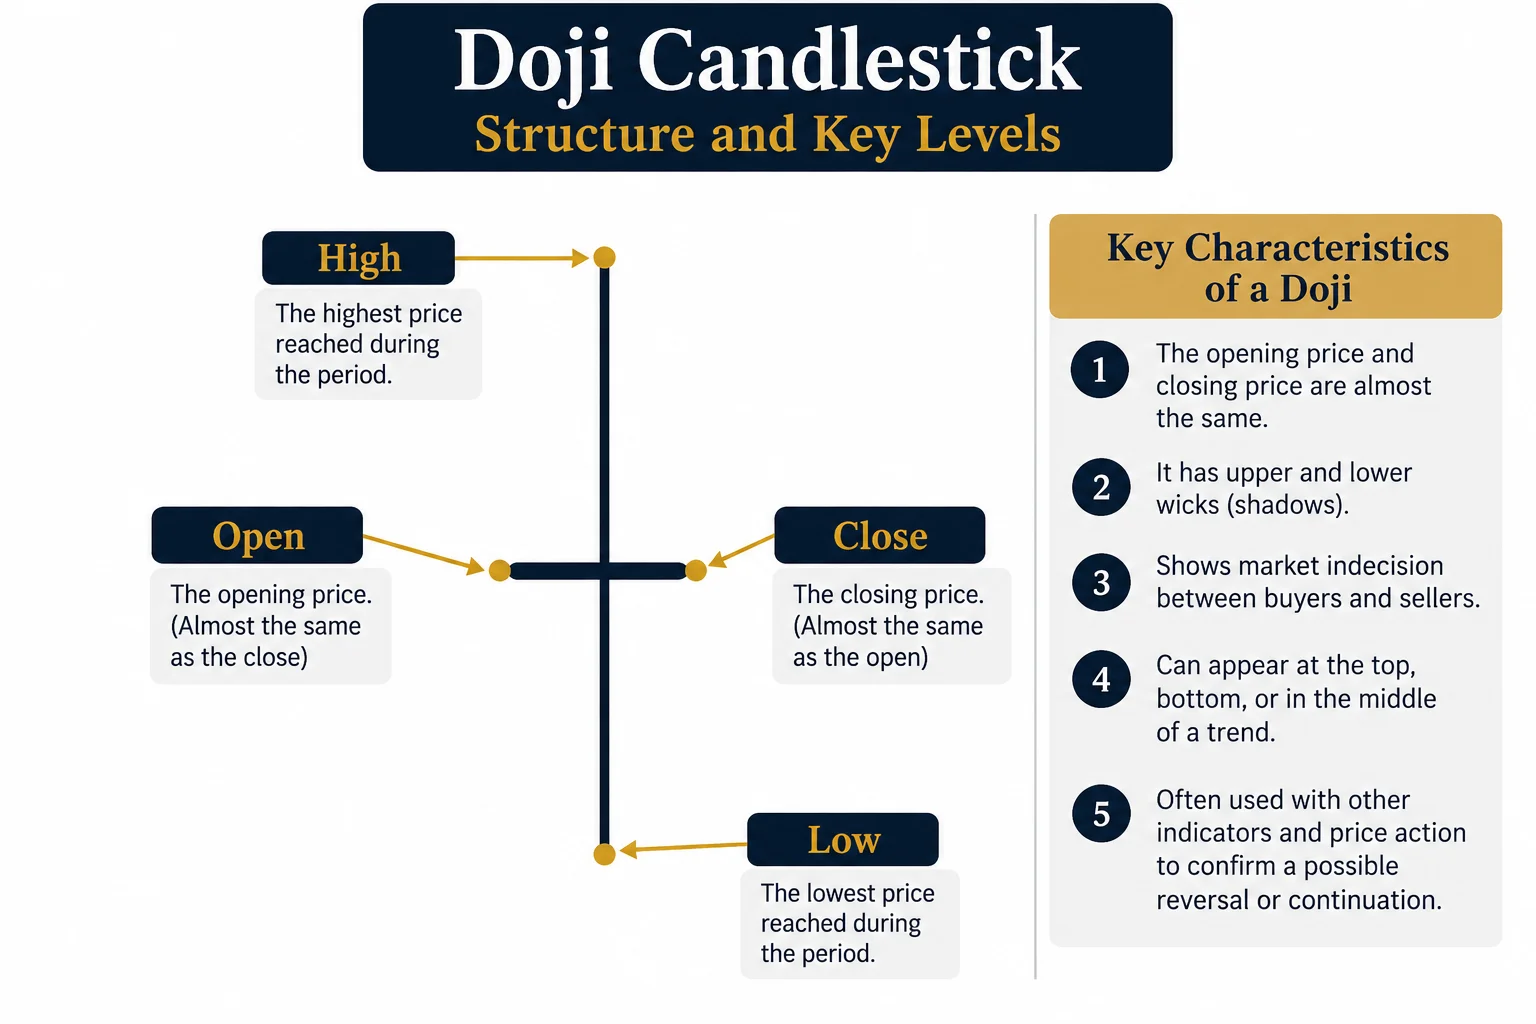
When you first open a chart, sometimes, you see a shape that looks like a tiny cross or a plus sign. This is the doji. Most beginners think this little shape means the market is tired or about to change direction. Honestly speaking, that is not exactly what is happening. To understand the basics of how to read candles, you have to imagine a tug of war. A doji happens when the buyers and the sellers are pulling with the exact same strength. The price moves up, then it moves down, but by the time the candle closes, it ends up right back where it started. It shows a stalemate. It is a moment of total indecision in the market. Even me, when I started, I used to think every doji was a signal to flip my trade. I would see one and think, "The trend is stopping now!" I was wrong so many times. A doji does not mean the trend is over. It just means the market is catching its breath and deciding where to go next.
The Market Mechanics Behind the Cross
You might wonder why price would return to the start. It is because of how big banks and institutions move money. They cannot just buy or sell everything at once. They need to find enough liquidity, which is just a fancy way of saying "other people to trade with," to fill their huge orders. When price moves quickly, retail traders like us often panic and jump in. The big players use our orders to get in or out of their own positions. When the banks finish their business, the price often snaps back to the middle.
That is why you see that flat line. It is not just a random shape. It is a footprint left behind by big money absorbing the small traders. This matters for your money because it shows you where the "smart money" might be active. If you see a doji, you are looking at a place where the market has stopped to fight. Understanding this helps you realise when to stay out of the market instead of forcing a trade. You can learn more about how wicks show us who is in control to refine this view.
Why Most Traders Misread the Doji
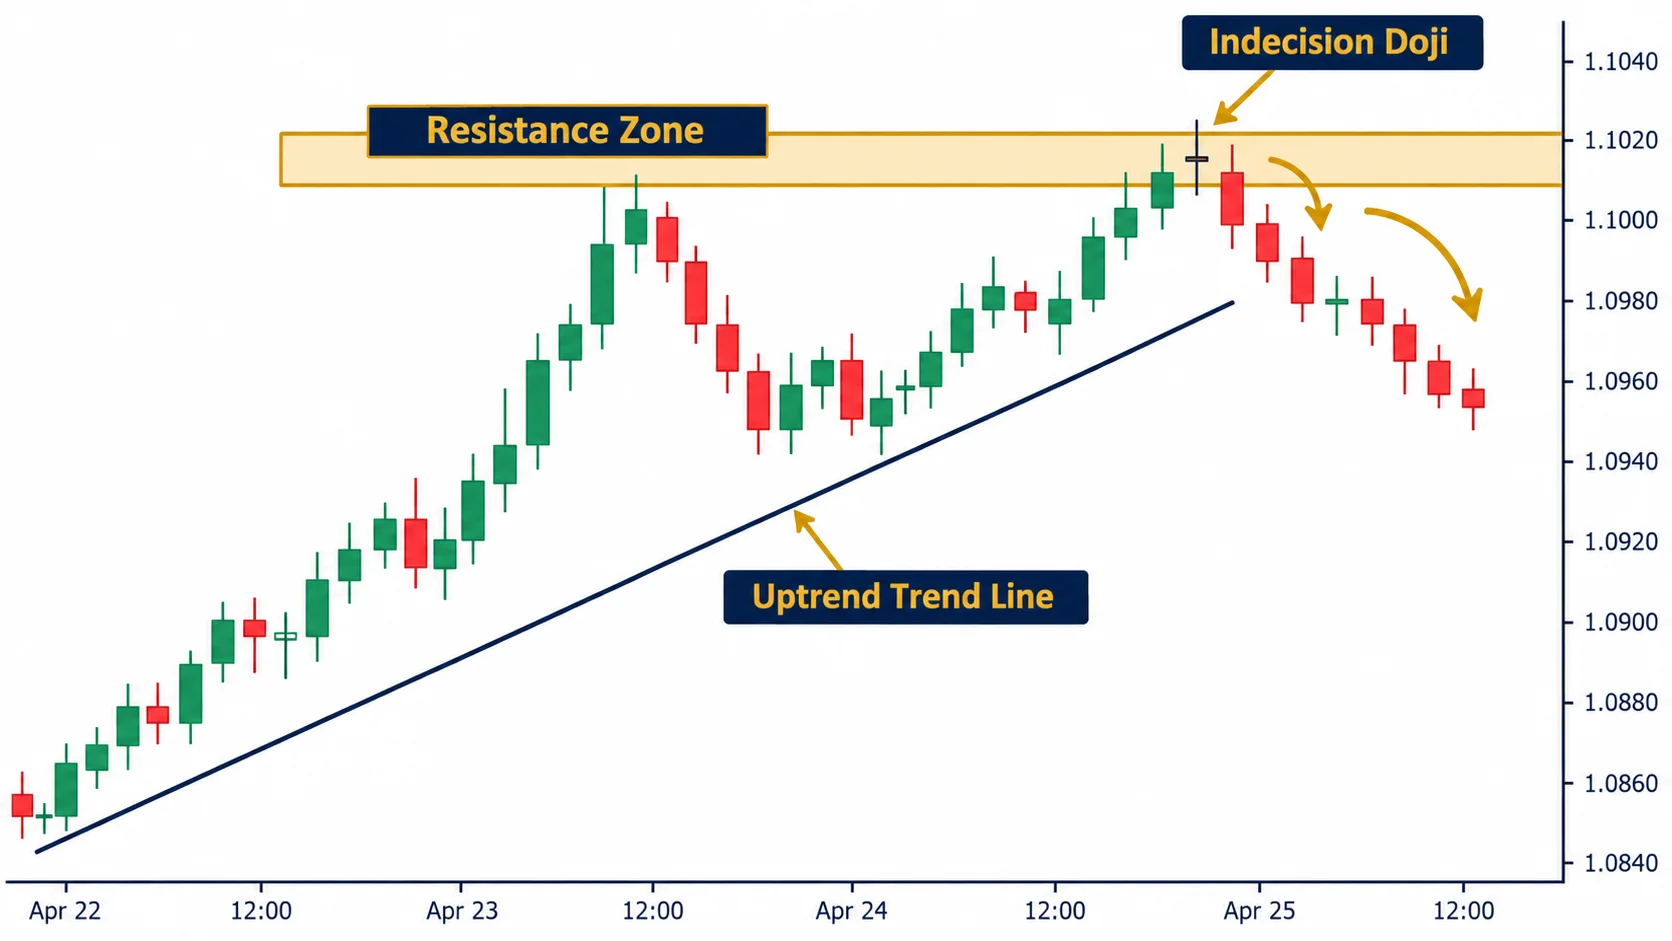
The biggest mistake I see beginners make is treating the doji like a crystal ball. They think, "A doji appeared, so the market must turn around." This is a quick way to lose your account. If you just sell because you see a doji in an uptrend, you are often selling right into the path of the next big move up. I remember my first real account. I saw a doji on the daily chart of a major pair. I thought I was smart. I sold immediately, hoping for a big reversal. The market didn't care about my guess. It just kept going up, and I lost 1% of my account in one go. I learnt that way that a doji is not a signal to act. It is a signal to wait. Never guess what the market will do. Wait for the next candle to show you who won the battle. If the price breaks above the high of the doji, the buyers are still in charge. If it breaks below the low, the sellers are taking over. Only then do you have a clue. You should also realise that patterns need the right context to have any real value.
Different Types of Doji Patterns
Not all doji shapes are the same. You should pay attention to the wicks, which are the long lines sticking out of the body. They tell a story about who fought hardest.
Standard Doji: This is the simple cross. It means total balance. Nobody is winning.
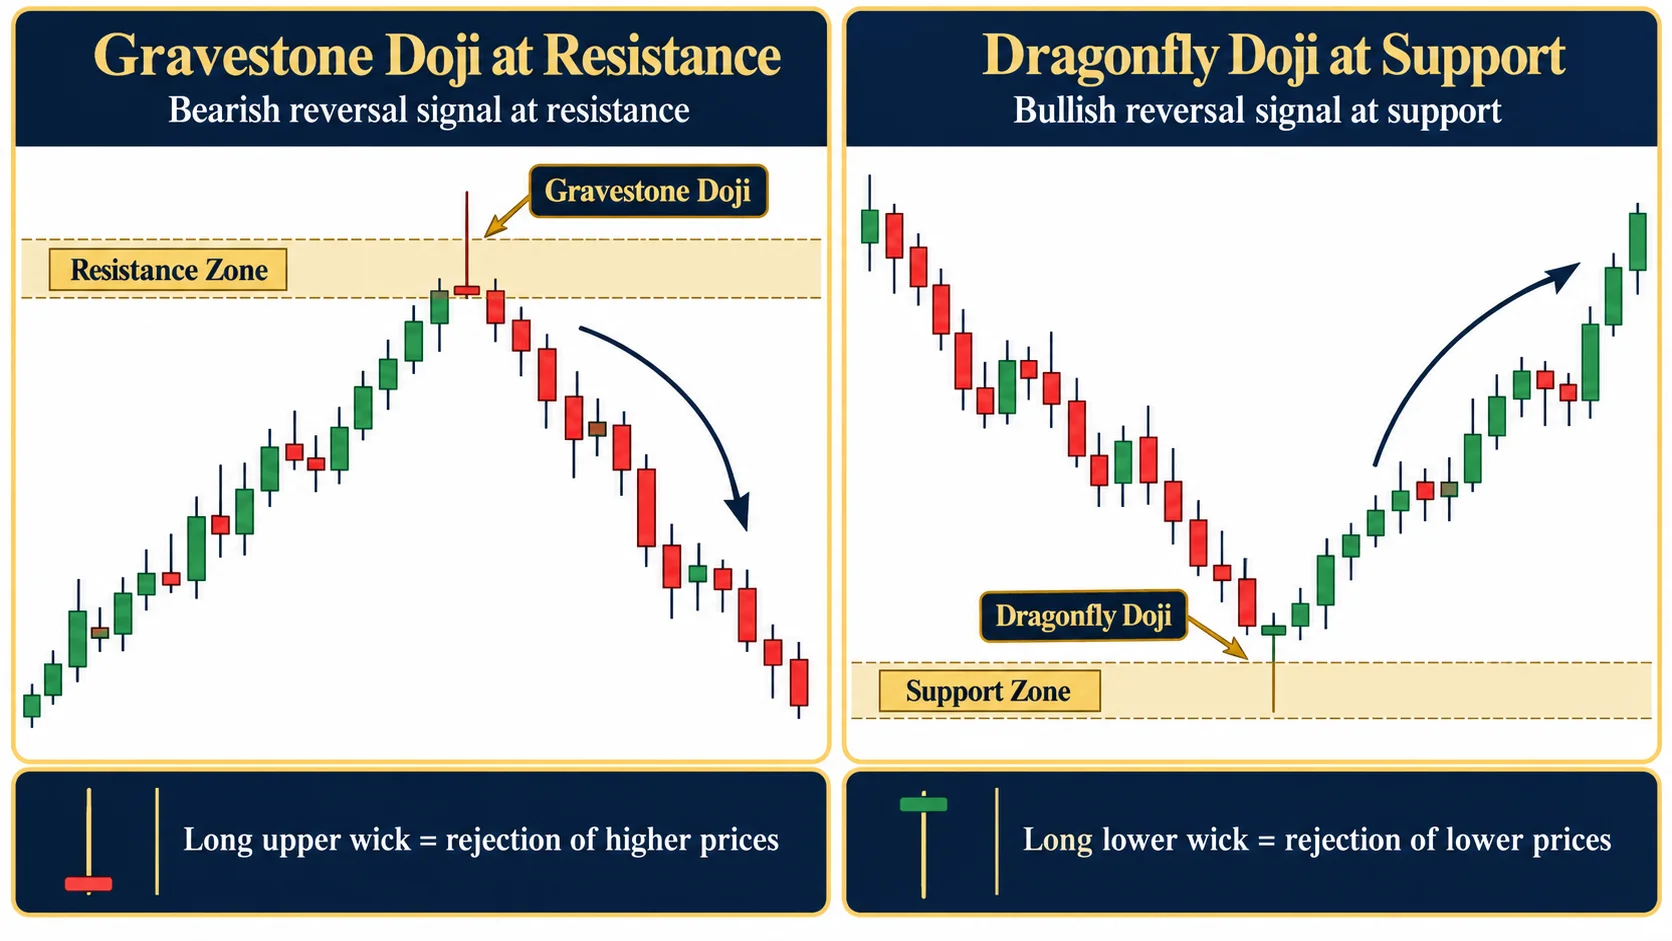
Gravestone Doji: This looks like an upside down 'T'. The price tried to go up, but sellers pushed it all the way back down. It shows that sellers were very strong.
Dragonfly Doji: This looks like a capital 'T'. The price tried to go down, but buyers pushed it all the way back up. It shows that buyers were strong at the bottom.
Long-Legged Doji: These have very long wicks. They show that the market was very nervous and volatile during that time.
How to Trade a Doji Without Getting Faked Out
If you want to use this to make a decision, you need a plan. Don't just trade every doji you see. I only look for them when they hit a key area, like a support or resistance level. 1. Find a major price level where the market has turned before. 2. Wait for a doji to form exactly at that level. 3. Mark the high and the low of that doji with a horizontal line. 4. Wait for the next candle to close outside that box. 5. If the next candle closes above the high, you might look to buy. If it closes below the low, you might look to sell. For example, let us say you are trading EUR/USD. You see a doji at a clear support level. You decide to risk 1% of your account. If the doji is 20 pips tall, you place your stop loss just on the other side of it, maybe 5 pips below the low.
If you enter after the break, you aim for a profit that is three times your risk. This means if you lose, you lose 1% of your account, but if you win, you gain 3%. This is how you set up your trade size properly. Even I used to move my stops because I was scared. I would see a tiny wick pass my entry and think the trade was dead. I would close it early. Then, minutes later, the price would fly in the direction I wanted. It taught me that if my math is right and my stop is set, I must let the trade work.
Why Context is King
A doji in the middle of nowhere is just noise. It does not mean anything. You must see it at a point of interest. A point of interest is a place where you expect the market to react. This could be a past high, a past low, or a supply zone. When a doji appears at these levels, it shows that the battle is happening exactly where it matters. That is when you should pay attention.
If you see a doji in the middle of a big trend, it is often just a small pause. It is not a reversal. Always check your higher timeframes to see the bigger picture. I learnt that my use of support and resistance levels became much better once I stopped looking for patterns in isolation. The candle is just the final score of the match. The level is the field where the match is played. You need both to understand the game.
Managing the Emotional Rollercoaster
Trading is as much about your mind as it is about the charts. When a doji forms, your brain will try to trick you. It will scream "Buy!" or "Sell!" because it hates uncertainty. It wants you to feel like you know what is coming next. But you don't know. Nobody knows. That is the hardest lesson of all. The doji is the market's way of saying "I am not sure yet." If the market is not sure, why should you be? It is perfectly okay to stay on the sidelines. Sometimes, the best trade is the one you do not take. I used to force trades because I felt like I had to be "doing something." I thought sitting still meant I was failing. The opposite is true. Protecting your capital is the most important job you have. If the doji doesn't give you a clear reason to enter, just walk away. The market will still be there tomorrow.
The Reality of Market Conditions
Patterns like the doji are just tools. They do not guarantee profit. Good risk management is what actually keeps you in the game. I have had perfect setups that still failed because the market decided to hunt for liquidity. Remember the story about my first losing trade? I put my stop loss too tight. I wanted to be "safe," but the market moved just enough to trigger me before going in the right direction. It was painful. After that, I learnt to give my trades room to breathe. Never put your stop loss exactly where everyone else is putting theirs. The banks know where those stops are, and they love to take them. I am not your financial adviser. This is only what I have learnt from my own time on the charts. Trading is not about being right every time. It is about staying consistent and protecting your capital.
Where To Read Next
If you want to keep learning, these are the ones I would read next.
- How to Read Candlestick Patterns for Beginners in Forex
- How to Trade Hammer and Shooting Star Candles in Forex
- How to Trade Bullish and Bearish Engulfing Candles in Forex
- How to Read Bullish and Bearish Candlesticks in Forex
- How to Trade a Pin Bar Candlestick Strategy in Forex
Frequently Asked Questions
What does a doji candlestick mean in forex trading?
It means the market is in a state of balance. The price opened and closed at almost the same level, showing that neither buyers nor sellers could take control during that time.
Why do my stop losses keep getting hit right after a doji appears?
Many traders place their stop loss orders right at the edge of the doji. Since this is a common spot, the market often moves there to gather liquidity before moving in the actual direction, which hits those stops.
How do I trade a doji candlestick pattern correctly?
Do not trade the doji itself. Wait for the candle after the doji to close outside of the doji's high or low range. This confirms which side is winning the battle.
Is a doji always a sign of a trend reversal?
No, it is not. A doji only shows indecision. The market might reverse, but it might also just pause before continuing in the same direction it was going before.
What is the difference between a dragonfly doji and a gravestone doji?
A dragonfly doji looks like a 'T' and often appears at support, suggesting buyers are pushing back. A gravestone doji looks like an upside-down 'T' and often appears at resistance, suggesting sellers are pushing back.
Found this helpful? Share it with someone who needs it.